|

-
Feb 14th, 2025, 10:52 AM
#1
Re: On MSChart scatter plot, I want solid lines instead of dashed
 Originally Posted by StanH

I don't know how to create a xy scatter plot from x,y numbers with a PictureBox control.
Just for grins.
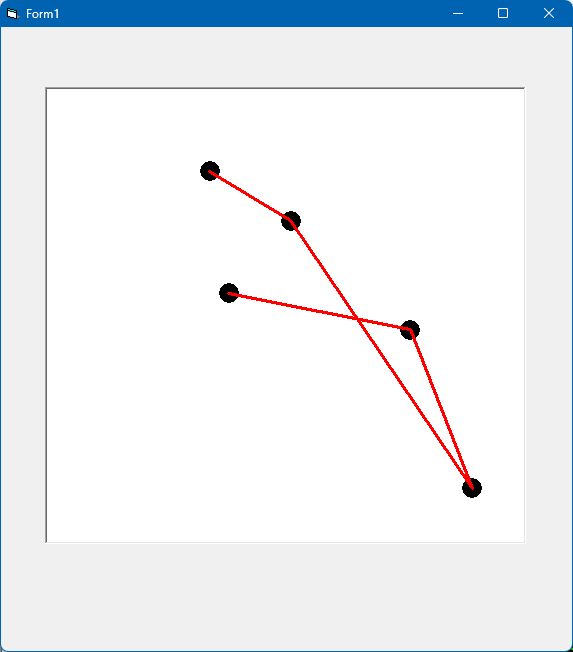
Start a new Form1 project. Throw a PictureBox on it, and rename it to "pic".
Add this code and run it:
Code:
Option Explicit

Dim Data(1 To 5, 1 To 2) As Single

Private Sub Form_Load()
    '
    ' Just create some sample data.
    Data(1, 1) = 3.4: Data(1, 2) = 8.2
    Data(2, 1) = 5.1: Data(2, 2) = 7.1
    Data(3, 1) = 8.9: Data(3, 2) = 1.2
    Data(4, 1) = 7.6: Data(4, 2) = 4.7
    Data(5, 1) = 3.8: Data(5, 2) = 5.5
    '
    ' Setup our "pic" PictureBox, with some appropriate scaling for this data.
    pic.BackColor = vbWhite
    pic.AutoRedraw = True
    pic.ScaleWidth = 10
    pic.ScaleLeft = 0
    pic.ScaleHeight = -10   ' We specify negative to flip the vertical axis to be more in line with graphing.
    pic.ScaleTop = 10
    '
    ' Now plot it as a scatter plot.
    pic.FillStyle = vbFSSolid       ' Make sure we fill our circles.
    pic.FillColor = vbBlack         ' Fill with black color.
    Dim i As Long
    For i = LBound(Data, 1) To UBound(Data, 1)
        pic.Circle (Data(i, 1), Data(i, 2)), 0.2, vbBlack   ' Draw black dot.
    Next
    '
    ' Now, do we want to connect these with a line?  Ok.
    pic.DrawStyle = vbSolid         ' Specify that solid lines are to be used.
    pic.DrawWidth = 3               ' Draw a nice thickness line.
    For i = LBound(Data, 1) + 1 To UBound(Data, 1)
        pic.Line (Data(i - 1, 1), Data(i - 1, 2))-(Data(i, 1), Data(i, 2)), vbRed   ' Draw red lines between dots.
    Next
End Sub
Any software I post in these forums written by me is provided "AS IS" without warranty of any kind, expressed or implied, and permission is hereby granted, free of charge and without restriction, to any person obtaining a copy. To all, peace and happiness.
Tags for this Thread
 Posting Permissions
- You may not post new threads
- You may not post replies
- You may not post attachments
- You may not edit your posts
-
Forum Rules
|
Click Here to Expand Forum to Full Width
|



 Reply With Quote