|

-
Jan 27th, 2021, 03:07 PM
#1
Thread Starter
Member

Programming an editable graphic in VB Forms Application
I have a request to build an element in a VB.net application using graphics. This is an area I am not familiar with and hoping someone can point me in a direction for research and coding examples.
The concept is a locked down graph with x and y axis and the allowing of a dot to be moved into the graph anywhere in the frame. It can be above or below, right or left of the axis lines, or dead center, or on any one line like below.
The location of the dot within the axis means something to the user.
Dot needs to be a consistent size which makes me wonder if I could drag and drop something I pre-define
I need to either store the graphic or maybe the coordinates in a database record
I need to be able to re-animate the graphic so the dot can be moved in an edit and saved again in the database
Been playing with an idea to stack radio buttons with hard drawn lines on a form to simulate the graph but user asking for overlapping radio buttons so dot can be on the line or touching the line. It is getting really complex.
Is there a control or something out there that can get me close to the requirements? Any direction or ideas would be appreciated.
Douglas
-
Jan 27th, 2021, 04:16 PM
#2
Re: Programming an editable graphic in VB Forms Application
Take a look at the GraphicsPath class. This is pretty convenient for drawing things that you want to interact with. The interaction may not be all that obvious. It's the IsOutlineVisible method.
Basically, you create your create your circle (AddEllipse) in your GraphicsPath, and hold that somewhere. In the Paint event of the form, you draw it to the screen with the Graphics object that is part of the e argument of the Paint event:
e.Graphics.DrawPath()
If you look at that AddEllipse method, you can see that it takes a rectangle, which is the bounding box of the circle. You could just save that, which would allow you to recreate as needed.
My usual boring signature: Nothing
 
-
Jan 27th, 2021, 07:50 PM
#3
Re: Programming an editable graphic in VB Forms Application
Not to say that anything Shaggy has said is wrong and that this is inherently better but you may like to follow the CodeBank link in my signature below and check out my thread on Manipulating GDI+ Drawings. You may be able to combine what I've done there with what Shaggy has suggested.
-
Jan 27th, 2021, 08:31 PM
#4
Thread Starter
Member
Re: Programming an editable graphic in VB Forms Application
Thank you both. That gives me a direction. I will look at these and try them out in detail tomorrow.
-
Jan 28th, 2021, 05:50 AM
#5
Re: Programming an editable graphic in VB Forms Application
 Originally Posted by Shaggy Hiker

Take a look at the GraphicsPath class. This is pretty convenient for drawing things that you want to interact with. The interaction may not be all that obvious. It's the IsOutlineVisible method.
You need IsVisible for hit-testing the dot, not IsOutlineVisible.
So I hope it's not too late to save you from wasting time wondering what color to choose for the Pen argument (answer: any color, it's ignored ). ).
BB
-
Jan 28th, 2021, 10:41 AM
#6
Re: Programming an editable graphic in VB Forms Application
Actually, IsOutlineVisible and IsVisible are both worth taking a look at. I thought I was using IsOutlineVisible, and I see that I am. However, thinking back over the uses I have...I'm not sure that I ever use closed polygons.
Last edited by Shaggy Hiker; Jan 28th, 2021 at 10:46 AM.
My usual boring signature: Nothing
-
Jan 28th, 2021, 06:15 PM
#7
Re: Programming an editable graphic in VB Forms Application
Originally Posted by DMoody007
...
The location of the dot within the axis means something to the user.
I need to either store the graphic or maybe the coordinates in a database record
I need to be able to re-animate the graphic so the dot can be moved in an edit and saved again in the database
...
I guess some questions would be "The location of the dot...means something", is that only a visual meaning, i.e. the method of positioning the dot and the coordinates used don't matter, as long as you can replicate the image with the dot in a specified position?
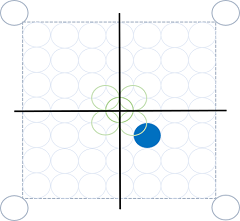
Because it looks like perhaps the dot should align with a limited number of positions, i.e. you have a 7x7 array of circles within the box, with five additional circles, one at the center of the grid, and four tangent to the sides of the center of the grid, and four outside the box, at the corners.
So, the four at the outer corners of the bounding box, are not aligned at the same spacing as the 49 inside the box, and of course, the five in the center of the box are also not aligned with the other 49 positions inside the box.
Is the dot position suppose to snap to those position, or be allowed to be placed anywhere?
Also, do you plot only one dot on the grid, or need to support multiple dots?
If it is only one dot on the grid, and the dot has to snap to the grid positions, then you wouldn't necessarily have to do hit testing on the dot. You can just find if you've clicked in one of the enumerated positions and if clicking or dragging in the center where you have overlapping circles, which is the closest.
Assuming the above is the case, here is an example that defines the center position of each of the circles, based on the definition of the radius size, and adds them to a list. The example can then compare the X,Y position of the Mouse in the MouseDown and MouseMove events to determine if the position is inside one of the circles, and save the index of where it was found in the list as the "coordinate" of the dot, i.e. an enumerated position value.
It uses the radius value, and the list of circle positions to draw the grid.
Your example showed the grid being drawn over the dot, so the example also draws the dot first, and then the grid when the paint event occurs.
The paint event is triggered by the code whenever the "coordinate" index value changes.
Just start a new project, and paste the code below into it to try it out.
Code:
Public Class Form1
    Dim Radius As Integer = 30

    Private DotPositions As New List(Of Point)
    Private Boundary As Rectangle
    Private CurrentDotIndex As Integer
    Private WithEvents GridBox As New PictureBox

    Private Sub Form1_Load(sender As Object, e As EventArgs) Handles MyBase.Load
        DefineGrid()

        GridBox.BackColor = Color.White
        GridBox.Location = New Point(10, 10)
        GridBox.Size = Boundary.Size + New Size(3.5 * Radius, 3.5 * Radius)
        GridBox.Visible = True
        Me.Controls.Add(GridBox)
    End Sub

    Private Sub DefineGrid()
        Dim p As Point
        Dim sqr2 As Double = Math.Sin(Math.PI / 4)  'sine of 45 degrees, i.e. 0.7071...

        'upper Left (center of upperleft circle)
        p.X = Radius
        p.Y = Radius
        DotPositions.Add(p)

        'Boundary of graph box
        Boundary.Location = p + New Size(sqr2 * Radius, sqr2 * Radius)
        Boundary.Size = New Point(14 * Radius, 14 * Radius)

        'upper Right circle
        p.X = Boundary.X + Boundary.Width + sqr2 * Radius
        DotPositions.Add(p)

        'lower Left circle
        p.Y = p.X
        p.X = Radius
        DotPositions.Add(p)

        'lower right circle
        p.X = p.Y
        DotPositions.Add(p)

        'draw "grid" of background circles
        Dim x As Integer, y As Integer
        Dim lx As Integer, ty As Integer
        lx = Boundary.X + Radius
        ty = Boundary.Y + Radius
        For y = 0 To 6
            p.Y = ty + y * (2 * Radius)
            For x = 0 To 6
                p.X = lx + x * (2 * Radius)
                DotPositions.Add(p)
            Next
        Next

        Dim center As Integer = Boundary.X + 7 * Radius
        p.X = center
        p.Y = center
        DotPositions.Add(p)    'Center Circle
        CurrentDotIndex = DotPositions.Count - 1

        p.X = center - Radius
        p.Y = center - Radius
        DotPositions.Add(p)     'UpperLeft Center

        p.X = center + Radius
        DotPositions.Add(p)     'UpperRight Center

        p.Y = center + Radius
        DotPositions.Add(p)     'LowerRight Center

        p.X = center - Radius
        DotPositions.Add(p)     'LowerLeft Center
    End Sub

    Private Sub GridBox_Paint(sender As Object, e As PaintEventArgs) Handles GridBox.Paint
        DrawDot(e.Graphics)
        DrawGrid(e.Graphics)
    End Sub

    Private Sub DrawDot(g As Graphics)
        With DotPositions(CurrentDotIndex)
            g.FillEllipse(Brushes.Blue, .X - Radius, .Y - Radius, 2 * Radius, 2 * Radius)
        End With
    End Sub

    Private Sub DrawGrid(g As Graphics)
        For Each p As Point In DotPositions
            g.DrawEllipse(Pens.LightBlue, New Rectangle(p.X - Radius, p.Y - Radius, 2 * Radius, 2 * Radius))
        Next
        For i As Integer = DotPositions.Count - 5 To DotPositions.Count - 1
            With DotPositions(i)
                g.DrawEllipse(Pens.LightGreen, New Rectangle(.X - Radius, .Y - Radius, 2 * Radius, 2 * Radius))
            End With
        Next
        g.DrawRectangle(Pens.Blue, Boundary)
        Using p As New Pen(Brushes.Black, 3)
            Dim center As Integer = Boundary.X + 7 * Radius
            g.DrawLine(p, center, DotPositions(0).Y, center, DotPositions(2).Y)
            g.DrawLine(p, DotPositions(0).X, center, DotPositions(1).X, center)
        End Using
    End Sub

    Function FindDotIndex(x As Integer, y As Integer) As Integer
        Static DistanceLimit As Integer = Radius * Radius
        Dim Idx As Integer = -1
        Dim Dist, dx, dy As Integer
        Dim LeastDist As Integer = DistanceLimit

        For i = 0 To DotPositions.Count - 1
            With DotPositions(i)
                dx = x - .X
                dy = y - .Y
            End With
            Dist = dx * dx + dy * dy
            If Dist < LeastDist Then
                LeastDist = Dist
                Idx = i
            End If
        Next

        Return Idx
    End Function

    Private Sub DotPositionUpdate(x As Integer, y As Integer)
        Dim newIdx As Integer = FindDotIndex(x, y)

        If newIdx <> -1 Then
            If newIdx <> CurrentDotIndex Then
                CurrentDotIndex = newIdx
                GridBox.Invalidate()
            End If
        End If
    End Sub

    Private Sub GridBox_MouseDown(sender As Object, e As MouseEventArgs) Handles GridBox.MouseDown
        DotPositionUpdate(e.X, e.Y)
    End Sub

    Private Sub GridBox_MouseMove(sender As Object, e As MouseEventArgs) Handles GridBox.MouseMove
        If e.Button = MouseButtons.Left Then
            DotPositionUpdate(e.X, e.Y)
        End If
    End Sub
End Class
Last edited by passel; Jan 28th, 2021 at 06:32 PM.
"Anyone can do any amount of work, provided it isn't the work he is supposed to be doing at that moment" Robert Benchley, 1930
-
Apr 14th, 2021, 03:05 PM
#8
Thread Starter
Member
Re: Programming an editable graphic in VB Forms Application
Sorry for the long delay. Covid, world upside down, blah, blah, blah...
Thanks to everyone that replied. Very much appreciated.
Passel - Wow! I tried your code example. I owe you a beer or something for that. I used the resources others pointed me to and your code sample and was able to get this to work as needed. It was amazing how you coded to look exactly like my little drawing. Many thanks.
Just curious - I am assuming I could just as easily code an ASP.net webpage with the same code. Anyone see a reason why not? Thinking about maybe using it for reporting the coordinates I stored from the Application and applying to web reporting of results.
Again. Many thanks for the assist to all.
-
Apr 14th, 2021, 03:55 PM
#9
Re: Programming an editable graphic in VB Forms Application
My usual boring signature: Nothing
-
Apr 14th, 2021, 04:07 PM
#10
Thread Starter
Member
Re: Programming an editable graphic in VB Forms Application
-
Apr 14th, 2021, 07:45 PM
#11
Re: Programming an editable graphic in VB Forms Application
Originally Posted by DMoody007
I am assuming I could just as easily code an ASP.net webpage with the same code. Anyone see a reason why not?
The reason is that rendering of web pages is completely different Windows Forms. You can use similar principles to determine what the code has to do but the code itself will be quite different.
Tags for this Thread
 Posting Permissions
- You may not post new threads
- You may not post replies
- You may not post attachments
- You may not edit your posts
-
Forum Rules
|
Click Here to Expand Forum to Full Width
|


 Reply With Quote


