|

-
Feb 6th, 2015, 12:02 PM
#1
Thread Starter
Hyperactive Member


 [RESOLVED] MSchart Scaling and Moving Multiple Data Points [RESOLVED] MSchart Scaling and Moving Multiple Data Points
---- EDIT 2/10/2015 ----
I have successfully completed my task of Manipulating, Scaling and relocating multiple values in an MSChart in VB.Net code. I needed to use a formula method, which is typed below in comment 7 (I think), which took me several days of calculating to come up with.
Everything is done through data binding, fraction scaling, and mathematical equations with loops. I have a mouse down, mouse up, mouse click and mouse move event in order to capture all of these.
BUT!!! My question still remains the same. Is there an easier way to do this?!? This has been going for almost a week (I think) and still no answers.
Thanks everyone  !!!! !!!!
---- EDIT 2/8/2015 ----
Well I have answered one of my own questions, which is the relocation of the data points. I figured out after days of smacking my head that I needed to use the MouseClick event instead of the MouseDown event to grab two data points (Duh). But with that information I was able to loop through the data points and move them based on the difference between the old end point and the new location (by math functions).
So, only thing left is my last question. Which, like I stated before, I have an equation for, its just working out out. Is it still feasible or is there a better way?
---- END EDIT ----
CURRENTLY ALL ANSWERED
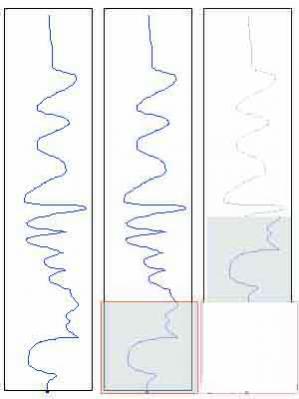
I have a chart that populates from a collection of data in a DataGridView in which its binded. I have many points which need to be selected with either a loop (select point A and point B) or a transparent box drawing (all points within that range). Once selected they need to do two things, to be able to click on selected points and drag all of them to another position on the Y axis (first set of images) or scale the selected points (shown in second images).
I have the code complete so I can drag/drop and manipulate the position of one point, so I know that the loop method (selecting the start point and end point) would work for relocating each point in that range. My first problem is I don’t know how to select a multi range and loop through them. I have tried the normal loop methods, but I cannot seem to get it to work at all. I think I am doing it completely wrong so I scrapped my loop code and brought it here. ")
First question:
1. How do I set up a loop for datapoints in a spline/line/fastline graph in MSChart?
COMPLETE
My next problem is scaling the selected points like in the second set of images? I thought I could do it with a math equation, something like:
Code:
            Dim i As Integer
            Dim x As Integer
            Dim scaleRation As Integer = 0.05

            Dim NumberOfPoints As Integer
            NumberOfPoints = 1

            For i = StartPoint To EndPoint
                NumberOfPoints = NumberOfPoints + 1
            Next

            For x = StartPoint To EndPoint
                x = x * (scaleRation / NumberOfPoints)
            Next
Of course that is not working code, but the concept is there. A math function of “x * (1/(however many points))” and then the next would be “x * (2/(however many points))” and so on so that it would scale each loop perspectival.
Second question:
2. Can my code (well, more like idea) work, and is there an easier way to do this that I have overlooked?
COMPLETE
The code that I am currently using to manipulate individual points on the chart is listed below. I am using a Mousedown, MouseMove and Mouseup combined with HitTest to select one point and move it on the Y axis.
Code:
Public Class Form1


    Dim dtG2 As DataTable


    Dim pointIndex As Integer
    Dim pointIndexstart As Integer
    Dim pointIndexend As Integer


    Private selectedDataPoint As DataPoint = Nothing
    Private selectedDataPointStart As DataPoint = Nothing
    Private selectedDataPointEnd As DataPoint = Nothing
    Private selectedDataPoints As DataPointCollection = Nothing


    Dim htrResult As HitTestResult = Nothing
    Dim htrResult2 As HitTestResult = Nothing


    '/ <summary>
    '/ Mouse Down Event
    '/ </summary>
    Private Sub Chart3_MouseDown(ByVal sender As Object, ByVal e As System.Windows.Forms.MouseEventArgs) Handles Chart3.MouseDown
        ' Call Hit Test Method


        'checks to see if curser is on


                'Go through points setting design elements back to default


                If e.Button = MouseButtons.Right Then

                    Dim hitResult As HitTestResult = Chart3.HitTest(e.X, e.Y)


                    ' Initialize currently selected data point
                    selectedDataPoint = Nothing
                    If hitResult.ChartElementType = ChartElementType.DataPoint Then
                        selectedDataPoint = CType(hitResult.Object, DataPoint)
                        pointIndex = Chart3.Series(1).Points.IndexOf(selectedDataPoint)

                        ' Show point value as label
                        selectedDataPoint.IsValueShownAsLabel = True

                        ' Set cursor shape
                        Chart3.Cursor = Cursors.SizeNS
                    End If
                End If


    End Sub 'Chart1_MouseDown

    Private Sub Chart3_MouseMove(ByVal sender As Object, ByVal e As System.Windows.Forms.MouseEventArgs) Handles Chart3.MouseMove
        ' Check if data point selected


            If Not (selectedDataPoint Is Nothing) Then
                ' Mouse coordinates should not be outside of the chart
                Dim coordinate As Integer = e.Y
                If coordinate < 0 Then
                    coordinate = 0
                End If
                If coordinate > Chart3.Size.Height - 1 Then
                    coordinate = Chart3.Size.Height - 1
                End If
                ' Calculate new Y value from current cursor position
                Dim yValue As Double = Chart3.ChartAreas(0).AxisY.PixelPositionToValue(coordinate)
                yValue = Math.Min(yValue, Chart3.ChartAreas(0).AxisY.Maximum)
                yValue = Math.Max(yValue, Chart3.ChartAreas(0).AxisY.Minimum)

                ' Update selected point Y value
                selectedDataPoint.YValues(0) = yValue
                Try


                    dtG2.Rows(pointIndex).Item("MD") = yValue
                Catch ex As Exception

                End Try
                ' Invalidate chart
                Chart3.Invalidate()


            Else
                ' Set different shape of cursor over the data points
                Dim hitResult As HitTestResult = Chart3.HitTest(e.X, e.Y)
                If hitResult.ChartElementType = ChartElementType.DataPoint Then
                    Chart3.Cursor = Cursors.Hand
                Else
                    Chart3.Cursor = Cursors.Default
                End If
            End If

    End Sub

    '/ <summary>
    '/ Mouse Up Event
    '/ </summary>
    Private Sub Chart3_MouseUp(ByVal sender As Object, ByVal e As System.Windows.Forms.MouseEventArgs) Handles Chart3.MouseUp
        ' Initialize currently selected data point

            If Not (selectedDataPoint Is Nothing) Then
                ' Hide point label
                selectedDataPoint.IsValueShownAsLabel = False

                ' reset selected object
                selectedDataPoint = Nothing

                ' Invalidate chart
                Chart3.Invalidate()

                ' Reset cursor style
                Chart3.Cursor = Cursors.Default


        End If


    End Sub 'Chart1_MouseUp
Moving selected data points to new location (complete)
resizing and scaling selected data points (Complete)

Thanks for the help!
Last edited by Frabulator; Feb 10th, 2015 at 09:29 AM.
-
Feb 7th, 2015, 09:04 AM
#2
Thread Starter
Hyperactive Member
Re: MSchart Scaling and Moving Multiple Data Points
Bumping it up 
-
Feb 8th, 2015, 09:40 AM
#3
Thread Starter
Hyperactive Member
Re: MSchart Scaling and Moving Multiple Data Points
bump
-
Feb 9th, 2015, 08:08 AM
#4
Thread Starter
Hyperactive Member
Re: MSchart Scaling and Moving Multiple Data Points
Bump again
-
Feb 9th, 2015, 01:01 PM
#5
Thread Starter
Hyperactive Member
Re: MSchart Scaling and Moving Multiple Data Points
Well I figured out part of the code, which was properly setting up a loop so that it loops through selected ranges in the chart. Using a loop and the mouse click function I have been able to drag multiple points across the graph and relocate them where I want them. The code for that is listed below (Given that to make it work you need to combind it with the mousemove code provided above).
Code:
                    If Not (selectedDataPointEnd Is Nothing) Then
                        ' Mouse coordinates should not be outside of the chart
                        Dim coordinate As Integer = e.Y
                        If coordinate < 0 Then
                            coordinate = 0
                        End If
                        If coordinate > Chart3.Size.Height - 1 Then
                            coordinate = Chart3.Size.Height - 1
                        End If


                        '______________________________________________________________________________________________________
                        ' Calculate new Y value from current cursor position
                        Dim yValue As Double = Chart3.ChartAreas(0).AxisY.PixelPositionToValue(coordinate)
                        yValue = Math.Min(yValue, Chart3.ChartAreas(0).AxisY.Maximum)
                        yValue = Math.Max(yValue, Chart3.ChartAreas(0).AxisY.Minimum)

                        ' Update selected point Y value


                        Dim oringinalY As Int32 = selectedDataPointEnd.YValues(0)
                        Dim newY As Int32 = yValue
                        selectedDataPointEnd.YValues(0) = yValue

                        Try


                            For i As Integer = pointIndexstart To pointIndexend
                                Dim Diff As Int32 = oringinalY - newY
                                Dim OYChart As Int32 = Chart3.Series(1).Points(i).YValues(0)
                                Dim finalCAlk As Int32 = OYChart - Diff

                                Chart3.Series(1).Points(i).YValues(0) = finalCAlk

                                dtG2.Rows(i).Item("MD") = finalCAlk

                            Next
                        Catch ex As Exception

                        End Try

                        Chart3.Cursor = Cursors.SizeNWSE

                        ' Invalidate chart
                        Chart3.Invalidate()


                    Else
                        ' Set different shape of cursor over the data points
                        Dim hitResult As HitTestResult = Chart3.HitTest(e.X, e.Y)
                        If hitResult.ChartElementType = ChartElementType.DataPoint Then
                            Chart3.Cursor = Cursors.Hand
                        Else
                            Chart3.Cursor = Cursors.Default
                        End If
                    End If
-
Feb 9th, 2015, 06:10 PM
#6
Thread Starter
Hyperactive Member
Re: MSchart Scaling and Moving Multiple Data Points
To everyone who is reading this I now have the mathematical equation figured out in order to scale the datapoints via loop. I am coding it now, and its rather hard to explain so I'll post it once I have it complete
-
Feb 10th, 2015, 09:06 AM
#7
Thread Starter
Hyperactive Member
Re: MSchart Scaling and Moving Multiple Data Points
For everyone like me who has been searching for weeks trying to find the equation for scaling data points, here it is.
Two numbers you first need to know are the start point and end point. The start point will always stay the same because you are scaling the view. You then need to find out the numbers between the start point and end point. Then you need to know what the end point is going to be, which is fine because that is the number you are manipulating. For this example I will have a number set as follows
Starting - Ending
20 - 20
21 - ?
22 - ?
23 - ?
24 - ?
25 - 35
With these three sets of numbers you can now scale the values. There are 6 numbers total, but you are only scaling 5 of them because the 1st number stays the same. So you take the end numbers and devide them together - EndFinal/EndOriginal (35/25). Which will give you the end fractioned difference - EFD (1.4). Next we need to create a fraction of the starting points, which is done the same way StartFinal/StartOriginal - SFD (20/20), which will always equal 1. After that you minus your two fractions to get the Fraction Difference - FD (0.4).
EFD = (EndFinal/EndOriginal)
SFD = (StartFinal/StartOriginal)
FD = EFD - SFD
Next comes the scaling. Because you are scaling 5 numbers total (not including the first number because it always stays the same) you need to scale each value based on a fraction of the total numbers - TN (5). For each one (i) you will divide by your TN, and then multiply that number, Fraction Scale - FS (1/5 = 0.2), by your FD number (0.4) which will then give you your Scale Ration - SR (0.08). Lastly in this step you add back on your SFD (1) to create your Final Multiplication Number - FMN (1.08). And this number is what you will need in order to create your scale for EACH data point. This part has to be put in the loop.
FS = i/TN
SR = FS x FD
FMN = SR + SFD
last you take the FMN (1.08) and multiply it by your Original Number - ON (21) and get your Scaled Value - SV (21 x 1.08 = 22.68).
SV = FMN x ON
And that is the equation. I have it typed out in code and it is working. I am trying to fine tooth it now, but you need to have the Decimals values set instead of the Int32 or integers, which would round it and you cant have that 
HOWEVER! My questions still stands. Is there any easier way of doing this?!
Also, I might want to patten this formula lol
-
Feb 10th, 2015, 09:47 AM
#8
Thread Starter
Hyperactive Member
Re: MSchart Scaling and Moving Multiple Data Points
-
Aug 19th, 2015, 07:15 AM
#9
Registered User
Re: MSchart Scaling and Moving Multiple Data Points
Try to use equation of the line.
for (x1, y1) (x2, y2) points
m = (y1 - y2) / (x1-x2); //slope
c = y1 - x1 * m; //const
Then, for any given x:
y = mx + c;
you can move multiple points with m as a scaled factor.
Tags for this Thread
 Posting Permissions
- You may not post new threads
- You may not post replies
- You may not post attachments
- You may not edit your posts
-
Forum Rules
|
Click Here to Expand Forum to Full Width
|


 Reply With Quote