|
-
Feb 2nd, 2009, 09:52 AM
#1
Thread Starter
Frenzied Member

 More Excel Woes With Graphing More Excel Woes With Graphing
Once again Excel is giving me no end of trouble. It does not want to let me choose me x-axis values how I would like. Basically as you can see from the image Excel is assuming that all the values are evenly spaced from each other. e.g. 0.1, 0.2, 0.3, 0.4 etc. However this is not the case. The gap between the readings decreases at a certain point. (0.4, 0.5, 0.52, 0.54 etc.)
How can I make Excel aware of this?
Thanks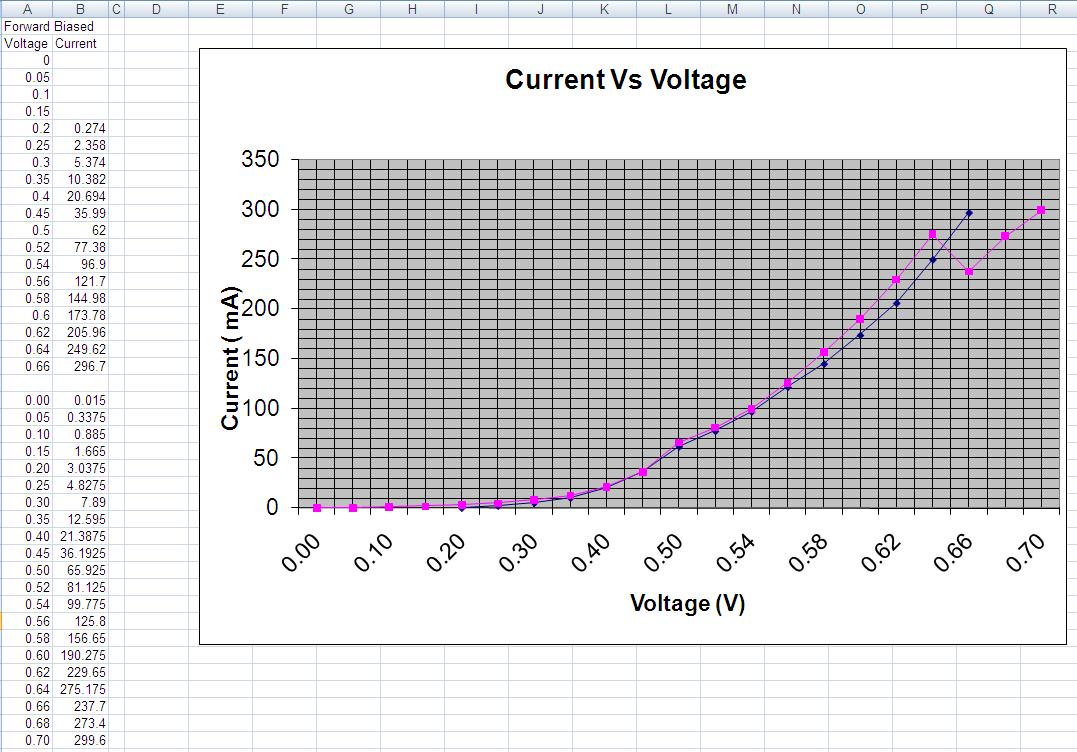
Last edited by 03myersd; Feb 2nd, 2009 at 10:20 AM.
-
Feb 2nd, 2009, 10:05 AM
#2
Hyperactive Member
Re: More Excel Woes With Graphing
I'm not sure if this belongs in this forum but you need to choose a scatter plot rather than a line graph.
 Posting Permissions
- You may not post new threads
- You may not post replies
- You may not post attachments
- You may not edit your posts
-
Forum Rules
|
Click Here to Expand Forum to Full Width
|


 Reply With Quote