|

-
May 24th, 2017, 10:23 AM
#1
Thread Starter
Member

 How to represent a scatter (X,Y) in MSChart in VB6? How to represent a scatter (X,Y) in MSChart in VB6?
Hello! I am new using VB6 and I want to know how to represent one serie of points in 2D.
I have two vectors x and Y of three elements each one and I have to represent each pair of coordinates (X,Y) in the MSChart.
Thank you!
-
May 24th, 2017, 04:18 PM
#2
Re: How to represent a scatter (X,Y) in MSChart in VB6?
ams
Welcome to VBForums .. 
Your description leaves me somewhat at a loss.
Could you give an example listing the x and y values of your 3 elements.
Spoo
-
May 24th, 2017, 08:34 PM
#3
Re: How to represent a scatter (X,Y) in MSChart in VB6?
Seen this yet:
VB6 - MSChart XY Scatter Demo
Or are you after something else?
-
May 25th, 2017, 08:15 AM
#4
Thread Starter
Member
Re: How to represent a scatter (X,Y) in MSChart in VB6?
 Originally Posted by Spooman

ams
Welcome to VBForums ..
Your description leaves me somewhat at a loss.
Could you give an example listing the x and y values of your 3 elements.
Spoo
X vector is [1 2 3]
Y vector is [4 5 6]
So I want to represent in the MSChart1 these points: (1, 4) (2, 5) (3, 6)
Thank you for your answer!
-
May 25th, 2017, 08:57 AM
#5
Thread Starter
Member
Re: How to represent a scatter (X,Y) in MSChart in VB6?
I have seen different examples but in my case I have to open a file, read it and plot the points.
For example:
X vector is [1 2 3]
Y vector is [4 5 6]
So I want to represent in the MSChart1 these points: (1, 4) (2, 5) (3, 6)
Here is my code. How can I represent the (X,Y) poins in MSChart1?
Private Sub Command1_Click()
Dim contentfile As String
Dim X() As String
Dim Y() As String
Dim C As Long
On Error GoTo fin
Form1.CommonDialog1.ShowOpen
Open Form1.CommonDialog1.FileName For Input As #1
Close #1
Open Form1.CommonDialog1.FileName For Input As #1
C = 0
Do Until EOF(1)
Line Input #1, contentfile
C = C + 1
Loop
Close #1
ReDim X(1 To C) As String
ReDim Y(1 To C) As String
C = 1
Open Form1.CommonDialog1.FileName For Input As #1
Do Until EOF(1) '
Line Input #1, contentfile
posicion_espacio = InStr(1, contentfile, " ")
X(C) = Mid(contentfile, 1, posicion_espacio - 1)
Y(C) = Mid(contentfile, posicion_espacio + 1, Len(contentfile) - posicion_espacio + 1)
Form1.Text1 = Form1.Text1 + X(C) + Y(C) + vbCrLf
C = C + 1
Loop
Close #1
fin:
End Sub
-
May 25th, 2017, 09:09 AM
#6
Re: How to represent a scatter (X,Y) in MSChart in VB6?
ams
OK, that helps
But I'm not sure that I can .. 
I'm not that familiar with MSChart.
I tried the demo that dilettante posted, and got that to work (although I don't understand what's going on)
I then tried to modify it to match your data definitions .. and got nowhere ..
Let's wait for dilettante to reply.
We'll both learn something
EDIT
I was responding to your post #4
Your post #5 got posted while I was composing this post, so I didn't see it at the time.
Spoo
Last edited by Spooman; May 25th, 2017 at 09:12 AM.
-
May 25th, 2017, 02:19 PM
#7
Re: How to represent a scatter (X,Y) in MSChart in VB6?
Maybe I don't understand.
Code:
Option Explicit

Private Sub Form_Load()
    Dim F As Integer
    Dim Row As Integer
    Dim X As Double
    Dim Y As Double

    With MSChart1
        .RandomFill = False
        .chartType = VtChChartType2dXY

        'Add data.
        F = FreeFile(0)
        Open "data.txt" For Input As #F
        .RowCount = 0
        .ColumnCount = 2 '2 columns (X and Y)
        Do Until EOF(F)
            Input #F, X, Y
            Text1.SelText = Str$(X) & "," & Str$(Y) & vbNewLine
            .RowCount = .RowCount + 1
            .DataGrid.SetData .RowCount, 1, X, False
            .DataGrid.SetData .RowCount, 2, Y, False
        Loop
        Close #F

        'Set up a white Wall.
        With .Plot.Wall.Brush
            .Style = VtBrushStyleSolid
            With .FillColor
                .Automatic = False
                .Set 255, 255, 255
            End With
        End With

        'Set up axes to 10 x 10.
        With .Plot.Axis(VtChAxisIdX).ValueScale
            .Auto = False
            .Minimum = 0
            .Maximum = 10
            .MajorDivision = 10
        End With
        With .Plot.Axis(VtChAxisIdY).ValueScale
            .Auto = False
            .Minimum = 0
            .Maximum = 10
            .MajorDivision = 10
        End With

        'Plot the series as small red circle markers with no lines.
        With .Plot.SeriesCollection(1)
            .SeriesType = VtChSeriesType2dXY
            With .SeriesMarker
                .Auto = False
                .Show = True
            End With
            With .DataPoints(-1).Marker
                .Style = VtMarkerStyleFilledCircle
                .Size = ScaleX(7, vbPixels, vbTwips)
                .Pen.VtColor.Set 255, 0, 0
            End With
            .ShowLine = False
        End With
    End With
End Sub

The data.txt file:
Last edited by dilettante; May 25th, 2017 at 02:26 PM.
-
May 25th, 2017, 03:03 PM
#8
Thread Starter
Member
Re: How to represent a scatter (X,Y) in MSChart in VB6?
Thank you! That is the result that I want but there is a little problem:
I have to select the file using a button a dialog window, not with the The line " Open "data.txt" For Input As #F"
I have to use something like
Form1.CommonDialog1.ShowOpen
Open Form1.CommonDialog1.FileName For Input As #1
How would be the code with this modification?
Thanks a lot for your help!!
-
May 25th, 2017, 03:21 PM
#9
Re: How to represent a scatter (X,Y) in MSChart in VB6?
Just make the change. There is almost nothing to it.
-
May 25th, 2017, 07:17 PM
#10
Re: How to represent a scatter (X,Y) in MSChart in VB6?
Originally Posted by Spooman
I'm not that familiar with MSChart.
It really is an "ugly monster of a control", and the time you need to properly understand its interface
+ the time you will waste whilst trying to work around its bugs, is often better invested
into "drawing your own from scratch" (especially if its simple Chart-Types like "Scatter" or X/Y-LineDiagrams).
You're still not very experienced with VB as it seems, but perhaps your math-skills are better, so there
might be a chance that you can make more sense out of routines which do not hide as many things from you
(with regards to the drawing and calculation of coordinates, which is study-able in "all its glory")...
Here is the 3 routines which ensure the complete ChartDrawing, doing it "by hand" with VB6:
Code:
Private Sub RefreshChart()
  ScaleMode = vbPixels 'we use normal Pixel-Dimensions for the Coords and Offsets
  ChartW = ScaleWidth - OffsL - OffsR 'ChartArea-Width is the FormClientArea-Width minus the Offsets
  ChartH = ScaleHeight - OffsT - OffsB 'dito for the ChartArea-Height (and its appropriate vertical Offsets)
  Cls 'clear the Screen

  If ScaleWidth <= OffsL + OffsR Then Exit Sub 'just a few checks, to avoid problems when resizing or minimizing the Form
  If ScaleHeight <= OffsT + OffsB Then Exit Sub
  If WindowState = vbMinimized Then Exit Sub

  Scale (0 - OffsL, ScaleHeight - OffsB)-(ScaleWidth - OffsL, 0 - OffsB) 'this switches VBs Coord-System to Bottom-Up-Direction

  DrawChartArea vbWhite, vbBlack 'draws the ChartArea and its Axes
  DrawValues DataPoints 'draws the Values of the DataPoints-Array
End Sub

Private Sub DrawChartArea(BackColor, AxisColor)
  Dim i As Long, CellW As Double, CellH As Double, P1 As Point, P2 As Point

  P1.x = 0:      P1.y = 0    'the next 3 lines just ensure the Background-fill of the ChartArea
  P2.x = ChartW: P2.y = ChartH
  RectFill P1, P2, BackColor

  CellW = ChartW / UBound(XAxisMarkers) 'calculate the "Cell-Width" between Markers
  CellH = ChartH / UBound(YAxisMarkers) 'calculate the "Cell-Height" between Markers

  For i = 0 To UBound(XAxisMarkers) 'Draw XAxis-Markers vertically
    P1.x = i * CellW: P1.y = -4
    P2.x = i * CellW: P2.y = ChartH
    DrawLine P1, P2, AxisColor
    DrawText P1, XAxisMarkers(i), AxisColor, vbCenter, False
  Next
  For i = 0 To UBound(YAxisMarkers) 'Draw YAxis-Markers horizontally
    P1.x = -4:     P1.y = i * CellH
    P2.x = ChartW: P2.y = i * CellH
    DrawLine P1, P2, AxisColor
    DrawText P1, YAxisMarkers(i), AxisColor, vbRightJustify, True
  Next
End Sub

Private Sub DrawValues(DataPoints() As Point)
Dim i As Long, AxisDX As Double, AxisDY As Double, CurP As Point
  AxisDX = ChartW / (XAxisMarkers(UBound(XAxisMarkers)) - XAxisMarkers(0))
  AxisDY = ChartH / (YAxisMarkers(UBound(YAxisMarkers)) - YAxisMarkers(0))

  For i = 0 To UBound(DataPoints)
    CurP.x = AxisDX * (DataPoints(i).x - XAxisMarkers(0))
    CurP.y = AxisDY * (DataPoints(i).y - YAxisMarkers(0))
    DrawPoint CurP, vbRed, 7
  Next
End Sub
Ok, here the entire Form-Code now (though you will still have to ensure
your Data-Reading from File into the x/y-Point-DataArray on your own)...:
Code:
Option Explicit
Private Type Point
x As Double
y As Double
End Type
'Offsets of the ChartArea in Pixels
Const OffsL As Double = 50, OffsT As Double = 30 'from the LeftTop-Corner of the Form
Const OffsR As Double = 20, OffsB As Double = 50 'and from the RightBottom-Corner
Private ChartW As Double, ChartH As Double
Private XAxisMarkers(), YAxisMarkers(), DataPoints() As Point
Private Sub Form_Load()
AutoRedraw = True
FontName = "Arial": FontSize = 10 'define the Font which is used in the Chart-Drawing
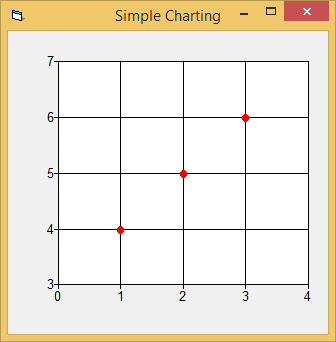
XAxisMarkers = Array(0, 1, 2, 3, 4) 'define the Axis-Labels for X
YAxisMarkers = Array(3, 4, 5, 6, 7) '...and dito for the Y-Axis
ReDim DataPoints(0 To 2) 'and a few example-DataPoints in an Array
DataPoints(0).x = 1: DataPoints(0).y = 4
DataPoints(1).x = 2: DataPoints(1).y = 5
DataPoints(2).x = 3: DataPoints(2).y = 6
End Sub
Private Sub Form_Resize()
RefreshChart
End Sub
'------------------ Chart-Drawing-Routines start here ------------------
Private Sub RefreshChart()
ScaleMode = vbPixels
ChartW = ScaleWidth - OffsL - OffsR 'ChartArea-Width is the FormClientArea-Width minus the Offsets
ChartH = ScaleHeight - OffsT - OffsB 'dito for the ChartArea-Height (and its appropriate vertical Offsets)
Cls 'clear the Screen
If ScaleWidth <= OffsL + OffsR Then Exit Sub 'just a few checks, to avoid problems when resizing or minimizing the Form
If ScaleHeight <= OffsT + OffsB Then Exit Sub
If WindowState = vbMinimized Then Exit Sub
Scale (0 - OffsL, ScaleHeight - OffsB)-(ScaleWidth - OffsL, 0 - OffsB) 'this switches the Coord-System to Bottom-Up-Direction
DrawChartArea vbWhite, vbBlack 'draw the ChartArea and its Axes
DrawValues DataPoints
End Sub
Private Sub DrawChartArea(BackColor, AxisColor)
Dim i As Long, CellW As Double, CellH As Double, P1 As Point, P2 As Point
P1.x = 0: P1.y = 0 'these 3 lines just ensure the Background-fill of the ChartArea
P2.x = ChartW: P2.y = ChartH
RectFill P1, P2, BackColor
CellW = ChartW / UBound(XAxisMarkers) 'calculate the "Cell-Width" between Markers
CellH = ChartH / UBound(YAxisMarkers) 'calculate the "Cell-Height" between Markers
For i = 0 To UBound(XAxisMarkers) 'Draw XAxis-Markers vertically
P1.x = i * CellW: P1.y = -4
P2.x = i * CellW: P2.y = ChartH
DrawLine P1, P2, AxisColor
DrawText P1, XAxisMarkers(i), AxisColor, vbCenter, False
Next
For i = 0 To UBound(YAxisMarkers) 'Draw YAxis-Markers horizontally
P1.x = -4: P1.y = i * CellH
P2.x = ChartW: P2.y = i * CellH
DrawLine P1, P2, AxisColor
DrawText P1, YAxisMarkers(i), AxisColor, vbRightJustify, True
Next
End Sub
Private Sub DrawValues(DataPoints() As Point)
Dim i As Long, AxisDX As Double, AxisDY As Double, CurP As Point
AxisDX = ChartW / (XAxisMarkers(UBound(XAxisMarkers)) - XAxisMarkers(0))
AxisDY = ChartH / (YAxisMarkers(UBound(YAxisMarkers)) - YAxisMarkers(0))
For i = 0 To UBound(DataPoints)
CurP.x = AxisDX * (DataPoints(i).x - XAxisMarkers(0))
CurP.y = AxisDY * (DataPoints(i).y - YAxisMarkers(0))
DrawPoint CurP, vbRed, 7
Next
End Sub
'------------------ End of Chart-Drawing-Routines ------------------
'the rest is just Point-based Drawing-Helpers which a Newbie at the moment can "take as given"
'(just use them in the routines above, along with Intellisense-Support, which VBs built-in Drawing-Helpers do not offer)
Private Sub DrawLine(P1 As Point, P2 As Point, LineColor, Optional ByVal LineWidth = 1)
ForeColor = LineColor: DrawWidth = LineWidth
Line (Int(P1.x), Int(P1.y))-(Int(P2.x), Int(P2.y))
PSet (Int(P2.x), Int(P2.y))
End Sub
Private Sub RectFill(P1 As Point, P2 As Point, LineColor, Optional ByVal LineWidth = 1)
DrawWidth = LineWidth
Line (Int(P1.x), Int(P1.y))-(Int(P2.x), Int(P2.y)), LineColor, BF
End Sub
Private Sub RectBorder(P1 As Point, P2 As Point, LineColor, Optional ByVal LineWidth = 1)
DrawWidth = LineWidth
Line (Int(P1.x), Int(P1.y))-(Int(P2.x), Int(P2.y)), LineColor, B
End Sub
Private Sub DrawText(P As Point, ByVal Text$, Color, Optional ByVal Align As AlignmentConstants, Optional ByVal VCenter As Boolean)
ForeColor = Color
If VCenter Then CurrentY = Int(P.y - TextHeight("|") / 2) Else CurrentY = Int(P.y)
If Align Then CurrentX = Int(P.x - TextWidth(Trim$(Text)) / Align) Else CurrentX = Int(P.x)
Print Text
End Sub
Private Sub DrawPoint(P As Point, Color, Optional ByVal PointSize = 5)
ForeColor = Color: DrawWidth = PointSize
PSet (Int(P.x), Int(P.y))
End Sub
HTH
Olaf
Last edited by Schmidt; May 25th, 2017 at 07:21 PM.
-
May 26th, 2017, 05:44 AM
#11
Thread Starter
Member
Re: How to represent a scatter (X,Y) in MSChart in VB6?
Originally Posted by dilettante
Just make the change. There is almost nothing to it.
I have tried to combine my code with yours I have many compilation problems...
Your solution is fantastic but If you could help me with thiat it would be great.
As you can see in my code I open the file in the subrutine Private Sub Command1_Click() with a commomdialog control that permits the selection of the file located in any directory using a button and a dialog window not using directly the name of the file.
Thank you a lot!
-
May 27th, 2017, 01:13 AM
#12
Re: How to represent a scatter (X,Y) in MSChart in VB6?
Olaf
You're still not very experienced with VB as it seems, but perhaps your math-skills are better, so there
might be a chance that you can make more sense out of routines which do not hide as many things from you
(with regards to the drawing and calculation of coordinates, which is study-able in "all its glory")...
Here is the 3 routines which ensure the complete ChartDrawing, doing it "by hand" with VB6:
Firstly, let me thank you for your extensively annotated code example and the corresponding image.
And yes, my experience with VB is limited to PictureBoxes, MSFlexGrids, and Access usage
(along with basic controls such as ControlButtons, Labels, Textboxes).
It really is an "ugly monster of a control"
Agreed.
I tried dilletante's example and was rather thrown by how the MSChart changed as I stepped
through each line of code.
and the time you need to properly understand its interface + the time you will waste whilst trying to work around its bugs, is often better invested into "drawing your own from scratch" (especially if its simple Chart-Types like "Scatter" or X/Y-LineDiagrams).
Again, agreed.
I make extensive use of charts, and my control of choice is the PictureBox. While this involves more
coding on my part, I have total control over the appearance,
- GridLines .. using the Line method, sometime solid, sometimes dashed
- Axis Labels
- Pan capability .. using a PB within a PB
- Zoom capability
- MouseMove trapping .. to synch one chart with another.
I saw you address at least the first two in your example. I imagine the others could be dealt with
as well. but I think I'll take a pass on the MSChart.
Again, thanks for you "tutorial".
Spoo
Last edited by Spooman; May 27th, 2017 at 01:25 AM.
 Posting Permissions
- You may not post new threads
- You may not post replies
- You may not post attachments
- You may not edit your posts
-
Forum Rules
|
Click Here to Expand Forum to Full Width
|


 Reply With Quote
