|

-
Jul 8th, 2015, 07:08 AM
#1
 [RESOLVED] Plotting scaled triangle [RESOLVED] Plotting scaled triangle
I have a triangle where I know all 3 side lengths, and all three angles.
I need a method to plot all 3 points relative to each other and scaled so the triangle width is 250 pixels or the triangle height is 250 pixels, whichever is greater without either width or height exceeding 250 pixels.
The start point is irrelevant as I have a function to reposition the points to draw the triangle in a bitmap...
I'd appreciate any assistance with this.
- Coding Examples:
- Features:
- Online Games:
- Compiled Games:
-
Jul 8th, 2015, 02:48 PM
#2
Re: Plotting scaled triangle
Do you allow rotating the triangle so the longest dimension is on a diagonal?
Or should the triangle orientation be fixed, and the triangle moved so that its longest dimension will be maximized to 250 pixels, and the other scaled and centered within the 250 pixels?
Or should the triangle be rotated so the "base" aligns horizontally so the width would be that side, and the height would be the opposite point?
In the fixed orientation case, it would seem you could use the same math as resizing a rectangular image to fit within a given rectangle area, figure out whether the rectangle inclosing the triangle it is taller or wider, and the gap remaining in that larger dimension direction to determine the scaling factor, then multiply the original deltas (between minimum and maximum X and Y values) by that amount.
-
Jul 8th, 2015, 06:55 PM
#3
Re: Plotting scaled triangle
With a 300,300 bitmap, I want to place point A.Y at 275. point A.X depends on whether angle A > 90 or not. Assuming 90, point A.X = 25 and point B.X = 25, with point B.Y being 275 - scaled length. Point C.X would then be 25 + scaled length and point C.Y would be 275.
But, this needs to be dynamic allowing for any angles, and I'm not making any progress trying to plot the points. My scaling routine determines a multiplier then moves point B and point C...
- Coding Examples:
- Features:
- Online Games:
- Compiled Games:
-
Jul 8th, 2015, 11:34 PM
#4
Re: Plotting scaled triangle
@passel
This is my latest attempt at the code, which doesn't work...
Code:
's_c is side AB
'a_A is angle A
Dim ptA As New Point(500, 500)
Dim x As Integer = CInt(500 - (s_c * 10) * Math.Cos((720 - a_A) * (Math.PI / 180)))
Dim y As Integer = CInt(500 + (s_c * 10) * Math.Sin((720 - a_A) * (Math.PI / 180)))
Dim ptB As New Point(x, y)
's_a is side BC
'a_B is angle B
Dim newX As Integer = CInt(x - (s_a * 10) * Math.Cos((720 - a_A + a_B) * (Math.PI / 180)))
Dim newY As Integer = CInt(y + (s_a * 10) * Math.Sin((720 - a_A + a_B) * (Math.PI / 180)))
Dim ptC As New Point(newX, newY)

Dim lineAB As Integer = lineLength(ptA, ptB) 'this is just a function that measures pixel length of the line
Dim lineBC As Integer = lineLength(ptB, ptC) 'same here

Dim pts() As Point = New Point() {ptA, ptB, ptC}

Dim multiplier As Decimal = CDec(250 / Math.Max(pts.Max(Function(p) p.X) - pts.Min(Function(p) p.X), pts.Max(Function(p) p.Y) - pts.Min(Function(p) p.Y)))

ptB = MaxDistanceEndPoint(ptA, ptB, CInt(lineAB * multiplier)) 'this is a function that will either extend or reduce the length between 2 points
ptC = MaxDistanceEndPoint(ptB, ptC, CInt(lineBC * multiplier)) 'same here

centreTriangle(ptA, ptB, ptC) 'this centres the triangle in a (300,300) area
- Coding Examples:
- Features:
- Online Games:
- Compiled Games:
-
Jul 9th, 2015, 12:08 AM
#5
Re: Plotting scaled triangle
p.s. Didn't see your code before I posted this.
I don't have the time to try to create a way to test this code, but here is what I came up with.
Looking back at your description, it seems to be pretty much what you described.
I treat the lower left corner (25,275) as (0,0) all the way through the relative calculations.
Since I can't really test it, but since it sounds quite like your description, hopefully you can try it without too much effort.
Also, I just realized I didn't do the Degree to Radian conversions, so changed the 90's to r90 and expect all the angles in the code to already be in Radians.
Code:
'Assume the Sides and Angles are set, as you mentioned.
  Dim SideAC As Double
  Dim SideAB As Double
  Dim SideBC As Double
  Dim angA As Double
  Dim angB As Double
  Dim angC As Double
  Dim A, B, C As PointF
  Const r90 As Double = Math.PI / 2

  Private Sub Compute()
    Dim dX As Double
    Dim Hght As Double
    Dim sf As Single
    Dim LenAC As Double

    If angA > r90 Then
      dX = Math.Sin(angA - r90) * SideAB
      Hght = Math.Cos(angA - r90) * SideAB
      A.X = CSng(dX)
      A.Y = 0
      B.X = 0
      B.Y = CSng(Hght)
      C.X = CSng(A.X + SideAC)
      C.Y = 0
      LenAC = SideAC + dX

    ElseIf angC > r90 Then
      dX = Math.Sin(angC - r90) * SideBC
      Hght = Math.Cos(angC - r90) * SideBC
      A.X = 0
      B.X = CSng(SideAC + dX)
      C.X = CSng(SideAC)
      A.Y = 0
      B.Y = CSng(Hght)
      C.Y = 0
      LenAC = SideAC + dX

    Else
      LenAC = SideAC
      Hght = Math.Cos(angA) * SideAB

      A.X = 0
      B.X = CSng(Math.Sin(angA) * SideAB)
      C.X = CSng(SideAC)
      A.Y = 0
      B.Y = CSng(Hght)
      C.Y = 0
    End If

    If LenAC > Hght Then
      sf = CSng(250 / SideAC)
    Else
      sf = CSng(250 / Hght)
    End If

    A.X = A.X * sf + 25
    B.X = B.X * sf + 25
    C.X = C.X * sf + 25

    A.Y = 275
    B.Y = 275 - B.Y * sf
    C.Y = 275
You can of course remove the " = 0" assignments
Last edited by passel; Jul 9th, 2015 at 12:36 AM.
-
Jul 9th, 2015, 12:37 AM
#6
Re: Plotting scaled triangle
Thanks for the code passel. I tested it with angle A as a right angle using known correct values and it worked great. I then tried rearranging the angles, putting the right angle in angle B... It threw an error, so I attempted to extend your code further:
Code:
Private Sub Compute(ByVal SideAC As Decimal, ByVal SideAB As Decimal, ByVal SideBC As Decimal, ByVal angA As Double, ByVal angB As Double, ByVal angC As Double, ByRef A As Point, ByRef B As Point, ByRef C As Point)
    Dim dX As Double
    Dim Hght As Double
    Dim sf As Single
    Dim LenAC As Double

    If angA >= 90 Then
        dX = Math.Sin(angA - 90) * SideAB
        Hght = Math.Cos(angA - 90) * SideAB
        A.X = CInt(dX)
        A.Y = 0
        B.X = 0
        B.Y = CInt(Hght)
        C.X = CInt(A.X + SideAC)
        C.Y = 0
        LenAC = SideAC + dX

    ElseIf angB >= 90 Then
        dX = Math.Sin(angB - 90) * SideAC
        Hght = Math.Cos(angB - 90) * SideAC
        A.X = 0
        B.X = CInt(SideAC + dX)
        C.X = CInt(SideAC)
        A.Y = 0
        B.Y = CInt(Hght)
        C.Y = 0
        LenAC = SideAC + dX

    ElseIf angC >= 90 Then
        dX = Math.Sin(angC - 90) * SideBC
        Hght = Math.Cos(angC - 90) * SideBC
        A.X = 0
        B.X = CInt(SideAC + dX)
        C.X = CInt(SideAC)
        A.Y = 0
        B.Y = CInt(Hght)
        C.Y = 0
        LenAC = SideAC + dX

    Else
        dX = Math.Sin(angA) * SideAB
        Hght = Math.Cos(angA) * SideAB
        LenAC = SideAC

    End If

    If LenAC > Hght Then
        sf = CSng(250 / SideAC)
    Else
        sf = CSng(250 / Hght)
    End If

    A.X = CInt(A.X * sf + 25)
    B.X = CInt(B.X * sf + 25)
    C.X = CInt(C.X * sf + 25)

    A.Y = 275
    B.Y = CInt(275 - B.Y * sf)
    C.Y = 275
End Sub
I highlighted the part I was unsure of. You should be able to test it with angles 90,53,37 and opposite sides 10,8,6. I'm trying to set it up where any of the 3 angles can be acute, right angled, or obtuse. So far your code seems as if it'll work with some minor adjustments...
- Coding Examples:
- Features:
- Online Games:
- Compiled Games:
-
Jul 9th, 2015, 12:43 AM
#7
Re: Plotting scaled triangle
I thought you were offline.
I noticed a few other things wrong with the code, eyeballing it, so made a few updates, the last updates you may not have seen. I don't know if they address the issues you already found or not.
The highlighted code should handle the obtuse angle being ang C, and dx should extend the AC length on that side.
The B.X value should thus be beyond C.X and be represented by that AC length + dx.
I'll look at it again to see if I made a typo.
p.s.
Strike that.
I see the highlighted code is for angle B > 90
I figured since you have the Base AC leg, and whatever height the perpendicular to point B is, the B angle is a don't care.
But I originally left out the setting of the point values in the Else case (which covers A and C being acute) and you didn't see that update at the time you picked it up.
You also are showing 90 (degrees) in the code, so I don't understand how that could be working properly in the math functions.
Last edited by passel; Jul 9th, 2015 at 12:53 AM.
-
Jul 9th, 2015, 12:56 AM
#8
Re: Plotting scaled triangle
I made some changes to your code >= instead of >
Without that I was getting a division by zero error in my label drawing sub
- Coding Examples:
- Features:
- Online Games:
- Compiled Games:
-
Jul 9th, 2015, 01:12 AM
#9
Re: Plotting scaled triangle
Ok.
I modified your code post #6 to what I think should work... Just noticed
I think
Code:
    If LenAC >= Hght Then
      sf = CSng(250 / SideAC)
    Else
'...

'should be
    If LenAC >= Hght Then
      sf = CSng(250 / LenAC)
    Else
'...
Code:
  Private Sub Compute(ByVal SideAC As Decimal, ByVal SideAB As Decimal, ByVal SideBC As Decimal, ByVal angA As Double, ByVal angB As Double, ByVal angC As Double, ByRef A As Point, ByRef B As Point, ByRef C As Point)
    Dim dX As Double
    Dim Hght As Double
    Dim sf As Single
    Dim LenAC As Double
    Const DEG2RAD As Double = Math.PI / 180

    Dim angAr As Double = angA * DEG2RAD
    Dim angBr As Double = angB * DEG2RAD
    Dim angCr As Double = angC * DEG2RAD

    If angAr >= r90 Then
      dX = Math.Sin(angAr - r90) * SideAB
      Hght = Math.Cos(angAr - r90) * SideAB
      A.X = CInt(dX)
      A.Y = 0
      B.X = 0
      B.Y = CInt(Hght)
      C.X = CInt(A.X + SideAC)
      C.Y = 0
      LenAC = SideAC + dX

    ElseIf angCr >= r90 Then
      dX = Math.Sin(angCr - r90) * SideBC
      Hght = Math.Cos(angCr - r90) * SideBC
      A.X = 0
      B.X = CInt(SideAC + dX)
      C.X = CInt(SideAC)
      A.Y = 0
      B.Y = CInt(Hght)
      C.Y = 0
      LenAC = SideAC + dX

    Else
      LenAC = SideAC
      Hght = Math.Cos(angAr) * SideAB
      A.X = 0
      B.X = CInt(Math.Sin(angAr) * SideAB)
      C.X = CInt(SideAC)
      A.Y = 0
      B.Y = CInt(Hght)
      C.Y = 0

    End If

    If LenAC >= Hght Then
      sf = CSng(250 / LenAC)
    Else
      sf = CSng(250 / Hght)
    End If

    A.X = CInt(A.X * sf + 25)
    B.X = CInt(B.X * sf + 25)
    C.X = CInt(C.X * sf + 25)

    A.Y = 275
    B.Y = CInt(275 - B.Y * sf)
    C.Y = 275
  End Sub
-
Jul 9th, 2015, 01:19 AM
#10
Re: Plotting scaled triangle
I find the code in post #4 very difficult to interpret--a lot of it doesn't seem to make much sense. The code in post #5 looks pretty close, but I think it should instead be...
Code:
'Assume the Sides and Angles are set, as you mentioned.
    Dim dX As Double
    Dim Hght As Double
    Dim sf As Single
    Dim totWidth As Double, totHeight As Double

    If angA > r90 Then
      dX = -Math.Sin(angA) * SideAB
      Hght = Math.Cos(angA) * SideAB
      A.X = CSng(dX)
      A.Y = 0
      B.X = 0
      B.Y = CSng(Hght)
      C.X = CSng(A.X + SideAC)
      C.Y = 0

    Else
      dX = Math.Sin(angA) * SideAB
      Hght = Math.Cos(angA) * SideAB
      A.X = 0
      A.Y = 0
      B.X = CSng(dX)
      B.Y = CSng(Hght)
      C.X = CSng(SideAC)
      C.Y = 0

    End If
    totWidth = C.X
    totHeight = B.Y

    If totWidth > totHeight Then
      sf = CSng(250 / totWidth)
    Else
      sf = CSng(250 / totHeight)
    End If

    A.X = A.X * sf + 25
    B.X = B.X * sf + 25
    C.X = C.X * sf + 25

    A.Y = A.Y * sf + 25
    B.Y = B.Y * sf + 25
    C.Y = C.Y * sf + 25
Of course, these things are really finicky and it's easy to make little mistakes. My suggests are also untested (apologies).
The time you enjoy wasting is not wasted time.
Bertrand Russell
<- Remember to rate posts you find helpful.
-
Jul 9th, 2015, 01:43 AM
#11
Re: Plotting scaled triangle
@passel
That works a lot better, but (see image) the sides seem to be wrong lengths:

- Coding Examples:
- Features:
- Online Games:
- Compiled Games:
-
Jul 9th, 2015, 02:36 AM
#12
Re: Plotting scaled triangle
I did some testing, and one issue is that you convert to integer too soon, which messes the scaling up.
I had pointf instead of point type.
So, based on the limited testing I did, I added some more temporary variable so the Integer conversion only happens at the end.
Code:
  Private Sub Compute(ByVal SideAC As Decimal, ByVal SideAB As Decimal, ByVal SideBC As Decimal, ByVal angA As Double, ByVal angB As Double, ByVal angC As Double, ByRef A As Point, ByRef B As Point, ByRef C As Point)
    Dim dX As Double
    Dim Hght As Double
    Dim sf As Single
    Dim LenAC As Double
    Const DEG2RAD As Double = Math.PI / 180

    Dim angAr As Double = angA * DEG2RAD
    Dim angBr As Double = angB * DEG2RAD
    Dim angCr As Double = angC * DEG2RAD
    Dim ax, ay, bx, by, cx, cy As Double

    If angAr >= r90 Then
      dX = Math.Sin(angAr - r90) * SideAB
      Hght = Math.Cos(angAr - r90) * SideAB
      'A.X = CInt(dX)
      'A.Y = 0
      'B.X = 0
      'B.Y = CInt(Hght)
      'C.X = CInt(A.X + SideAC)
      'C.Y = 0
      ax = dX
      by = Hght
      cx = ax + SideAC

      LenAC = SideAC + dX

    ElseIf angCr >= r90 Then
      dX = Math.Sin(angCr - r90) * SideBC
      Hght = Math.Cos(angCr - r90) * SideBC
      'A.X = 0
      'B.X = CInt(SideAC + dX)
      'C.X = CInt(SideAC)
      'A.Y = 0
      'B.Y = CInt(Hght)
      'C.Y = 0
      bx = SideAC + dX
      cx = SideAC
      by = Hght
      LenAC = SideAC + dX

    Else
      LenAC = SideAC
      Hght = Math.Cos(angAr) * SideAB
      'A.X = 0
      'B.X = CInt(Math.Sin(angAr) * SideAB)
      'C.X = CInt(SideAC)
      'A.Y = 0
      'B.Y = CInt(Hght)
      'C.Y = 0
      bx = Math.Sin(angAr) * SideAB
      cx = SideAC
      by = Hght

    End If

    If LenAC >= Hght Then
      sf = CSng(250 / LenAC)
    Else
      sf = CSng(250 / Hght)
    End If

    A.X = CInt(ax * sf + 25)
    B.X = CInt(bx * sf + 25)
    C.X = CInt(cx * sf + 25)

    A.Y = 275
    B.Y = CInt(275 - by * sf)
    C.Y = 275
  End Sub
So this seems to work as I expect.
One thing that seems to hang me up mentally is the order of the parameters.
Perhaps the AC,AB,AC names are not the best.
Usually, most references refer to the Angle A, and the side opposite (which would be BC, in this case)
So, even if I kept the names, having the order of the first three parameters match the order of the angles would help me keep them straight.
BC, AC, AB, A, B, C, angA, angB, angC.
but, of course it is your program.
-
Jul 9th, 2015, 10:26 AM
#13
Re: Plotting scaled triangle
I agree with Passel that your labelling conventions are not the ones I am used to when it comes to geometry. Shouldn't matter though, as long as you pick a convention and stick to it. That said, I couldn't get Passel's code to work as I expected without swapping the Sin's and Cos's. Maybe we are using different systems and talking about different angles/lines.... dunno.
I was actually working on a simplistic Triangle Structure in answer to your question posed in "another place". There are so many clever (opinionated?  ) people over there that I felt like a daisy in the middle of a field of poppys, so you never got to see it. Anyways, you might as well have a look see now... ) people over there that I felt like a daisy in the middle of a field of poppys, so you never got to see it. Anyways, you might as well have a look see now...
The original solution was intended to allow you to pass in a line length and the angles at either end of the line (as per your original specification IIRC, and as also shown in your picture), and it would solve the triangle and expose the coordinates of the vertices via the Structure's Properties.
N.B. it relies on your given line being arranged horizontally along the x axis, with C to the right of A.
I have now extended it so that it uses the GDI+ coordinate system of positive Y going down (by simply making B's y coordinate negative; remember AC is drawn along the X axis), and also by adding a scaling function. None of the scaling is done using trigonometry.
If you now need a solution that allows you to specify an already solved triangle by way of all its line lengths and angles, it would be a trivial task to add an overloaded Sub New that has all those as parameters, and which calls the existing Sub New passing the relevant arguments.
Note that A and C are placed on the X axis (i.e. y = 0) with A.x = 0 to begin with, so C.x = the given line length. B is then calculated using the Law of Sines and some basic trig. If B falls to the left of A, all the values are translated horizontally so that B.x = 0. i.e. the triangle always sits on both the X and Y axes without crossing them
Also note that because A and C are placed on the X axis (y = 0), for B to appear above AC its y coordinate will be negative (using the GDI+ coordinate system), so you won't actually see a triangle if you just plot the points without translating them first. Is that too weird?
My original plan was to calculate the points using the classic Cartesian coordinates system that I was taught as a lad (Y positive up), and then create a method for plotting the triangle. The method would use a Drawing2D.Matrix to invert GDI+'s Y direction, along with the built in Graphics Class's translation and scaling methods so as to minimise the amount of code. That does actually work, but has a few problems, not least of which is that you need to know the graphics canvas size in advance. Not very versatile.
Having typed all that (omg!, sorry), with my luck you'll probably find this doesn't work after all
Needs a Form with PictureBox sized to 300x300 and a Button
VB.NET Code:
Imports System.Drawing.Drawing2D Public Class Form1 Private Sub Button1_Click(sender As System.Object, e As System.EventArgs) Handles Button1.Click Dim solvedTriangle As New Triangle(10, ConvertToRadians(37), ConvertToRadians(53)) solvedTriangle.ScaleToFit(250) ' plot it where ever... Dim bmp As New Bitmap(300, 300) Using g As Graphics = Graphics.FromImage(bmp) g.TranslateTransform(25, 275) g.DrawLine(Pens.Black, solvedTriangle.A, solvedTriangle.C) g.DrawLine(Pens.Black, solvedTriangle.C, solvedTriangle.B) g.DrawLine(Pens.Black, solvedTriangle.B, solvedTriangle.A) End Using PictureBox1.Image = bmp PictureBox1.Refresh() End Sub Private Function ConvertToRadians(angle As Double) As Double Return angle / 180 * Math.PI End Function End Class ''' <summary> ''' Calculate Vertices of Triangle given 3 angles and length of one side. ''' AC being horizontal along X axis (Y = 0), and leftmost point of triangle has X=0. ''' </summary> ''' <remarks> ''' C is to Right of A. ''' Leftmost point could be A or B (if B falls to Left of A). ''' All Points translated horizontally right if needed, to force X=0 for leftmost point. ''' Uses GDI+ coordinate system (Y increases down) ''' therefore B.Y will be less than A.Y, where A.Y = C.Y = 0, ''' so B.Y IS ALWAYS NEGATIVE. ''' </remarks> ''' Public Structure Triangle Public Property A As PointF Public Property B As PointF Public Property C As PointF ''' <param name="sideB">The length of the know side: assumed to be line AC</param> ''' <param name="angleA">The internal angle in Radians at vertex A</param> ''' <param name="angleC">The internal angle in Radians at vertex C</param> ''' <remarks></remarks> Public Sub New(sideB As Single, angleA As Double, angleC As Double) Dim angleB As Double Dim sideC As Single angleB = Math.PI - (angleA + angleC) sideC = CSng((sideB / Math.Sin(angleB)) * Math.Sin(angleC)) Dim bX As Single = CSng(Math.Cos(angleA) * sideC) Dim bY As Single = CSng(Math.Sin(angleA) * sideC) Me.A = PointF.Empty Me.C = PointF.Add(A, New SizeF(sideB, 0)) Me.B = New PointF(bX, -bY) If bX < 0 Then Me.A = PointF.Add(Me.A, New SizeF(-bX, 0)) Me.B = PointF.Add(Me.B, New SizeF(-bX, 0)) Me.C = PointF.Add(Me.C, New SizeF(-bX, 0)) End If End Sub Public Sub ScaleToFit(maxWidthOrHeight As Single) Dim xCoords() As Single = {Me.A.X, Me.B.X, Me.C.X} Dim OverallWidth As Single = xCoords.Max - xCoords.Min Dim OverallHeight As Single = Math.Abs(Me.B.Y) 'B.Y is negative owing to GDI+ coordinates Dim scaleFactor As Single = If(OverallWidth > OverallHeight, maxWidthOrHeight / OverallWidth, maxWidthOrHeight / OverallHeight) Scale(scaleFactor) End Sub Public Sub Scale(scaleFactor As Single) Me.A = ScalePointF(Me.A, scaleFactor) Me.B = ScalePointF(Me.B, scaleFactor) Me.C = ScalePointF(Me.C, scaleFactor) End Sub Private Function ScalePointF(pf As PointF, factor As Single) As PointF Return New PointF(pf.X * factor, pf.Y * factor) End Function End Structure
Oh yeah, you should of course make the Properties ReadOnly (... too much typing for me to do )
-
Jul 9th, 2015, 11:51 AM
#14
Re: Plotting scaled triangle
 Originally Posted by Inferrd

... That said, I couldn't get Passel's code to work as I expected without swapping the Sin's and Cos's. Maybe we are using different systems and talking about different angles/lines.... dunno.
Because of the parameter order, I had trouble getting it to produce what I expected in all cases at first as well.
I had to draw a couple of triangles on a sheet of paper and label the vertices and sides, with the various naming conventions and write the Side parameter order on the sheet as well, so I could map side a,b and c to the side names, and then to the parameter order.
Side, Side Name, Parameter (1 indexed)
a, SideBC, 3
b, SideAC, 1
c, SideAB, 2
CheetSheet
Compute (b, c, a, A, B, C, pA, pB, pC)
So the 3,4,5 triangle with Ang A=90, and sides a,b,c = 5, 4, 3 would be
Compute(4, 3, 5, 90, 53, 37, pA, pB, pC)
If you wanted C to be 90 degrees, so swap a's and b's then the call becomes
Compute(4, 5, 3, 37, 53, 90, pA, pB, pC)
It's that b, c, a, A, B, C, ... order that was confusing.
But I think .paul.'s perspective might have been, listing the sides in order of, Base, Left, right
Compute( base, left side, right side, A, B, C, ...) which makes sense when you look at it that way.
I used the Triangle calculator at this site to generate some numbers, and when I plugged them in the correct parameter order seemed to work as expected. I only did a few tests, i.e. Ang A being 110, Ang C being 110, and both AngA and C being less than 90.
Basically used the 3 Angle input calculation from the site, and used the normalized output values (longest side is always 1) as the side lengths and it scaled up fine.
Of course, it was off the cuff programming ending at 4 in the morning for me, so Inferrd's routines are definitely more library worthy.
-
Jul 10th, 2015, 12:13 AM
#15
Re: Plotting scaled triangle
Originally Posted by Inferrd
I agree with Passel that your labelling conventions are not the ones I am used to when it comes to geometry. Shouldn't matter though, as long as you pick a convention and stick to it. That said, I couldn't get Passel's code to work as I expected without swapping the Sin's and Cos's. Maybe we are using different systems and talking about different angles/lines.... dunno.
I was actually working on a simplistic Triangle Structure in answer to your question posed in "another place". There are so many clever (opinionated? ) people over there that I felt like a daisy in the middle of a field of poppys, so you never got to see it. Anyways, you might as well have a look see now...
The original solution was intended to allow you to pass in a line length and the angles at either end of the line (as per your original specification IIRC, and as also shown in your picture), and it would solve the triangle and expose the coordinates of the vertices via the Structure's Properties.
N.B. it relies on your given line being arranged horizontally along the x axis, with C to the right of A.
I have now extended it so that it uses the GDI+ coordinate system of positive Y going down (by simply making B's y coordinate negative; remember AC is drawn along the X axis), and also by adding a scaling function. None of the scaling is done using trigonometry.
If you now need a solution that allows you to specify an already solved triangle by way of all its line lengths and angles, it would be a trivial task to add an overloaded Sub New that has all those as parameters, and which calls the existing Sub New passing the relevant arguments.
Note that A and C are placed on the X axis (i.e. y = 0) with A.x = 0 to begin with, so C.x = the given line length. B is then calculated using the Law of Sines and some basic trig. If B falls to the left of A, all the values are translated horizontally so that B.x = 0. i.e. the triangle always sits on both the X and Y axes without crossing them
Also note that because A and C are placed on the X axis (y = 0), for B to appear above AC its y coordinate will be negative (using the GDI+ coordinate system), so you won't actually see a triangle if you just plot the points without translating them first. Is that too weird?
My original plan was to calculate the points using the classic Cartesian coordinates system that I was taught as a lad (Y positive up), and then create a method for plotting the triangle. The method would use a Drawing2D.Matrix to invert GDI+'s Y direction, along with the built in Graphics Class's translation and scaling methods so as to minimise the amount of code. That does actually work, but has a few problems, not least of which is that you need to know the graphics canvas size in advance. Not very versatile.
Having typed all that (omg!, sorry), with my luck you'll probably find this doesn't work after all
Needs a Form with PictureBox sized to 300x300 and a Button
VB.NET Code:
Imports System.Drawing.Drawing2D Public Class Form1 Private Sub Button1_Click(sender As System.Object, e As System.EventArgs) Handles Button1.Click Dim solvedTriangle As New Triangle(10, ConvertToRadians(37), ConvertToRadians(53)) solvedTriangle.ScaleToFit(250) ' plot it where ever... Dim bmp As New Bitmap(300, 300) Using g As Graphics = Graphics.FromImage(bmp) g.TranslateTransform(25, 275) g.DrawLine(Pens.Black, solvedTriangle.A, solvedTriangle.C) g.DrawLine(Pens.Black, solvedTriangle.C, solvedTriangle.B) g.DrawLine(Pens.Black, solvedTriangle.B, solvedTriangle.A) End Using PictureBox1.Image = bmp PictureBox1.Refresh() End Sub Private Function ConvertToRadians(angle As Double) As Double Return angle / 180 * Math.PI End Function End Class ''' <summary> ''' Calculate Vertices of Triangle given 3 angles and length of one side. ''' AC being horizontal along X axis (Y = 0), and leftmost point of triangle has X=0. ''' </summary> ''' <remarks> ''' C is to Right of A. ''' Leftmost point could be A or B (if B falls to Left of A). ''' All Points translated horizontally right if needed, to force X=0 for leftmost point. ''' Uses GDI+ coordinate system (Y increases down) ''' therefore B.Y will be less than A.Y, where A.Y = C.Y = 0, ''' so B.Y IS ALWAYS NEGATIVE. ''' </remarks> ''' Public Structure Triangle Public Property A As PointF Public Property B As PointF Public Property C As PointF ''' <param name="sideB">The length of the know side: assumed to be line AC</param> ''' <param name="angleA">The internal angle in Radians at vertex A</param> ''' <param name="angleC">The internal angle in Radians at vertex C</param> ''' <remarks></remarks> Public Sub New(sideB As Single, angleA As Double, angleC As Double) Dim angleB As Double Dim sideC As Single angleB = Math.PI - (angleA + angleC) sideC = CSng((sideB / Math.Sin(angleB)) * Math.Sin(angleC)) Dim bX As Single = CSng(Math.Cos(angleA) * sideC) Dim bY As Single = CSng(Math.Sin(angleA) * sideC) Me.A = PointF.Empty Me.C = PointF.Add(A, New SizeF(sideB, 0)) Me.B = New PointF(bX, -bY) If bX < 0 Then Me.A = PointF.Add(Me.A, New SizeF(-bX, 0)) Me.B = PointF.Add(Me.B, New SizeF(-bX, 0)) Me.C = PointF.Add(Me.C, New SizeF(-bX, 0)) End If End Sub Public Sub ScaleToFit(maxWidthOrHeight As Single) Dim xCoords() As Single = {Me.A.X, Me.B.X, Me.C.X} Dim OverallWidth As Single = xCoords.Max - xCoords.Min Dim OverallHeight As Single = Math.Abs(Me.B.Y) 'B.Y is negative owing to GDI+ coordinates Dim scaleFactor As Single = If(OverallWidth > OverallHeight, maxWidthOrHeight / OverallWidth, maxWidthOrHeight / OverallHeight) Scale(scaleFactor) End Sub Public Sub Scale(scaleFactor As Single) Me.A = ScalePointF(Me.A, scaleFactor) Me.B = ScalePointF(Me.B, scaleFactor) Me.C = ScalePointF(Me.C, scaleFactor) End Sub Private Function ScalePointF(pf As PointF, factor As Single) As PointF Return New PointF(pf.X * factor, pf.Y * factor) End Function End Structure
Oh yeah, you should of course make the Properties ReadOnly (... too much typing for me to do )
Thanks. That works great with a few modifications.
You're not Inferrd on MSDN, or I would've seen you there...
- Coding Examples:
- Features:
- Online Games:
- Compiled Games:
-
Jul 11th, 2015, 08:46 PM
#16
Re: Plotting scaled triangle
It's ironic that this was the final part of a trigonometry revision (solver with solution steps) tool, and I couldn't work out the trigonometry to plot the triangle...
- Coding Examples:
- Features:
- Online Games:
- Compiled Games:
-
Aug 5th, 2015, 04:55 AM
#17
Banned

Re: Plotting scaled triangle
This is great and just what I've been looking for. Thanks alot!!
-
Aug 6th, 2015, 11:48 AM
#18
Re: Plotting scaled triangle
A bit late - but I'll add a VB6-solution to the Pile ...
(needs a reference to vbRichClient5, which contains Wrapper-Classes for cairo):
Into a Class, named cTriangle:
Code:
Private mPath As cCairoPath, mScl#
Private xBR1#, yBR1#, xBR2#, yBR2# 'Coords for the Bounding-Rect of the Path

Friend Sub Init(sideB As Double, angleA As Double, angleC As Double)
Dim sideC As Double
    sideC = sideB / Sin(Cairo.PI - (angleA + angleC)) * Sin(angleC)

    With Cairo.WidgetBase.MeasureContext
      .MoveTo 0, 0 'Move to Point A
      .LineTo Cos(angleA) * sideC, Sin(angleA) * sideC 'Line to Point B
      .LineTo sideB, 0 'Line to Point C
      .ClosePath 'close (back to Point A)

      .GetPathExtents xBR1, yBR1, xBR2, yBR2 'store the extents class-internally
      Set mPath = .CopyPath 'as well as the resulting Path (with it's internal coords)
    End With
End Sub

Public Sub ApplyScaledPathTo(CC As cCairoContext, Optional ByVal Size# = 250)
    CC.Save
      mScl = IIf((xBR2 - xBR1) > yBR2, Size / (xBR2 - xBR1), Size / yBR2)
      CC.TranslateDrawings 0, -0.5 + Size 'shift down by Size (due to the neg. y-Scale below)
      CC.ScaleDrawings mScl, -mScl 'the neg. Value for the yScale ensures Bottom-Up-Coords
      CC.TranslateDrawings -xBR1, 0 'shift the x-Coord for correction (after the Scaling)
      CC.AppendPath mPath
    CC.Restore
End Sub
Into a Test-Form:
Code:
Private i&, CC As cCairoContext, Triangles(0 To 3) As New cTriangle 'we render 4 Triangles
Private Sub Form_Load()
Const RenderSize = 250
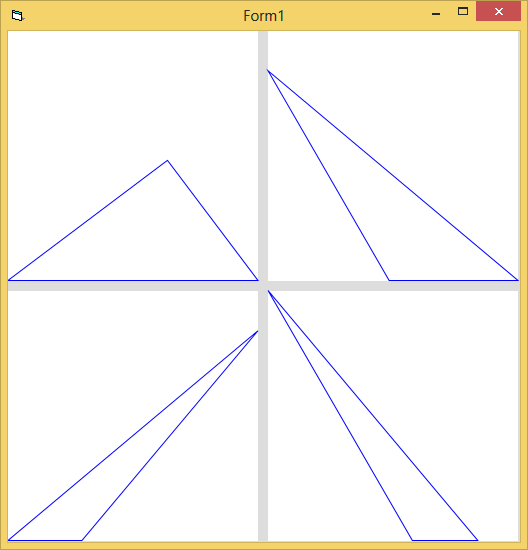
Triangles(0).Init 10, Deg2Rad(37), Deg2Rad(53)
Triangles(1).Init 10, Deg2Rad(120), Deg2Rad(40)
Triangles(2).Init 10, Deg2Rad(40), Deg2Rad(130)
Triangles(3).Init 10, Deg2Rad(120), Deg2Rad(50)
Set CC = Cairo.CreateSurface(800, 800).CreateContext 'create a Context
CC.Paint 1, Cairo.CreateSolidPatternLng(&HDDDDDD) 'ensure a BackColor
For i = 0 To 3 'render the 4 differently initialized Triangles
CC.Rectangle 0, 0, RenderSize, RenderSize
CC.Fill , Cairo.CreateSolidPatternLng(vbWhite)
Triangles(i).ApplyScaledPathTo CC, RenderSize
CC.SetLineWidth 1
CC.Stroke , Cairo.CreateSolidPatternLng(vbBlue)
If i Mod 2 = 1 Then CC.TranslateDrawings 2 * -RenderSize - 20, RenderSize + 10
CC.TranslateDrawings RenderSize + 10, 0
Next i
Set Picture = CC.Surface.Picture 'put the result into the Forms Picture-Prop
End Sub
Private Function Deg2Rad(Angle) As Double
Deg2Rad = Angle * Cairo.PI / 180
End Function
ScreenShot of the Result:
Olaf
-
Aug 9th, 2015, 06:20 AM
#19
Re: Plotting scaled triangle
I think to plot any triangle inside a 250x250 square is an easy task because we have 3 X1,X2,X3 and 3 Y1,Y2,Y3 so from that we get min max,
MixX=Min(X1,X2,X3)
MinY=Min(Y1,Y2,Y3)
MaxX=Max(X1,X2,X3)
MaxY=Max(Y1,Y2,Y3)
So now we get (anyX-MinX)/(MaxX-Minx)*250 as a value from 0 to 250
So now we get (anyY-MinY)/(MaxY-MinY)*250 as a value from 0 to 250
We draw the triangle and if we like we can add an offsetX and offsetY so we can put triangle to any offset
There is no matter if Xs or Ys are negatives...or positives or a mix of them.
Last edited by georgekar; Aug 9th, 2015 at 06:24 AM.
-
Aug 9th, 2015, 06:29 AM
#20
Re: Plotting scaled triangle
Sorry my previous algorithm make two scale usage, one for X and one for Y so we have to choose the best and that can be done choosing from abs((maxX-minX)/(MaxY-MinY)) if is >1 then use (anyXY-MinX)/(MaxX-Minx)*250 else (anyXY-MinY)/(MaxY-MinY)*250
-
Aug 9th, 2015, 11:37 AM
#21
Re: Plotting scaled triangle
I actually looked into this a lot further, and found that a Drawing2D.Matrix makes this easy:
Code:
Public Class TrianglePoints
    Public A As PointF
    Public B As PointF
    Public C As PointF

    ''' <summary>
    '''
    ''' </summary>
    ''' <param name="sideC">The proposed initial side AB length. For ratio calculating purposes.</param>
    ''' <param name="angleA">The internal angle in Degrees at vertex A</param>
    ''' <param name="angleB">The internal angle in Degrees at vertex B</param>
    ''' <param name="angleC">The internal angle in Degrees at vertex C</param>
    ''' <remarks></remarks>
    Public Sub New(ByVal sideC As Decimal, ByVal angleA As Decimal, ByVal angleB As Decimal, ByVal angleC As Decimal, _
                                        ByVal maxWidth As Decimal, ByVal maxHeight As Decimal, ByVal Rotation As Integer)

        'Convert Degrees to Radians
        angleA = CDec(angleA * (Math.PI / 180))
        angleB = CDec(angleB * (Math.PI / 180))
        angleC = CDec(angleC * (Math.PI / 180))

        'Calculate point B
        Dim bX As Decimal = CDec(Math.Cos(angleA) * sideC)
        Dim bY As Decimal = maxHeight - CDec(Math.Sin(angleA) * sideC)

        'Calculate relative side B length
        Dim sideB As Decimal = CDec((sideC / Math.Sin(angleC)) * Math.Sin(angleB))

        'Assign values to PointFs
        Me.A = New PointF(0, maxHeight)
        Me.C = New PointF(sideB, maxHeight)
        Me.B = New PointF(bX, bY)

        'Array to hold PointFs
        Dim pts() As PointF = New PointF() {A, B, C}

        'Create a Matrix and Rotate pts() Array
        Dim m As New Drawing2D.Matrix
        m.RotateAt(Rotation, New PointF(0, maxHeight))
        m.TransformPoints(pts)

        'Calculate maximum scale factor
        Dim actualWidth As Decimal = CDec(pts.Max(Function(p) p.X) - pts.Min(Function(p) p.X))
        Dim actualHeight As Decimal = CDec(pts.Max(Function(p) p.Y) - pts.Min(Function(p) p.Y))

        Dim scaleFactor As Decimal = Math.Min(maxWidth / actualWidth, maxHeight / actualHeight)

        'Scale pts() Array
        m = New Drawing2D.Matrix
        m.Scale(scaleFactor, scaleFactor)
        m.TransformPoints(pts)

        'Calculate offsets
        actualHeight = CDec(pts.Max(Function(p) p.Y) - pts.Min(Function(p) p.Y))

        Dim ox As Single = -pts.Min(Function(p) p.X)
        Dim oy As Single = -(pts.Min(Function(p) p.Y) - (maxHeight - actualHeight))

        'Offset pts() Array
        m = New Drawing2D.Matrix
        m.Translate(ox, oy)
        m.TransformPoints(pts)

        'Assign transformed Array values back to PointF member variables
        Me.A = pts(0)
        Me.B = pts(1)
        Me.C = pts(2)
    End Sub

End Class
I used 3 transformations: Rotating, Scaling, and Offsetting
- Coding Examples:
- Features:
- Online Games:
- Compiled Games:
-
Aug 9th, 2015, 02:27 PM
#22
Re: Plotting scaled triangle
This is my example. Triangles are not centered in target square but aligned to top left corner
Place in a form a picture box 8000x8000 twips
Code:
Private Sub Form_Load()
Picture1.Cls
Dim k As Single
For k = 0 To 10 Step 5
drawMe k
Next k
For k = 90 To 100 Step 5
drawMe k
Next k
For k = 180 To 190 Step 5
drawMe k
Next k
For k = 270 To 280 Step 5
drawMe k
Next k
End Sub
Private Sub drawMe(k As Single)
Dim x0 As Single, y0 As Single
Dim x1 As Single, y1 As Single
Dim x2 As Single, y2 As Single

x0 = 6500
y0 = 2000
MoveGr Picture1, x0, y0
Polar2Cartesian k, 600, x0, y0, x1, y1
DrawGr Picture1, x1, y1
Polar2Cartesian k - 90, 900, x1, y1, x2, y2
DrawGr Picture1, x2, y2
DrawGr Picture1, x0, y0
Dim MinX As Single, MinY As Single, MaxX As Single, MaxY As Single
MinX = Minimum(x0, x1, x2)
MaxX = Maximum(x0, x1, x2)
MinY = Minimum(y0, y1, y2)
MaxY = Maximum(y0, y1, y2)
Dim choose As Single, nscale As Single
choose = Abs((MaxX - MinX) / (MaxY - MinY))
nscale = 250 * Screen.TwipsPerPixelX

If choose >= 1 Then
MoveGr Picture1, Trans(x0, MinX, MaxX, nscale), Trans(y0 + MinX - MinY, MinX, MaxX, nscale)
DrawGr Picture1, Trans(x1, MinX, MaxX, nscale), Trans(y1 + MinX - MinY, MinX, MaxX, nscale)
DrawGr Picture1, Trans(x2, MinX, MaxX, nscale), Trans(y2 + MinX - MinY, MinX, MaxX, nscale)
DrawGr Picture1, Trans(x0, MinX, MaxX, nscale), Trans(y0 + MinX - MinY, MinX, MaxX, nscale)
Else
MoveGr Picture1, Trans(x0 + MinY - MinX, MinY, MaxY, nscale), Trans(y0, MinY, MaxY, nscale)
DrawGr Picture1, Trans(x1 + MinY - MinX, MinY, MaxY, nscale), Trans(y1, MinY, MaxY, nscale)
DrawGr Picture1, Trans(x2 + MinY - MinX, MinY, MaxY, nscale), Trans(y2, MinY, MaxY, nscale)
DrawGr Picture1, Trans(x0 + MinY - MinX, MinY, MaxY, nscale), Trans(y0, MinY, MaxY, nscale)

End If
MoveGr Picture1, 0, 0
DrawGr Picture1, nscale, 0
DrawGr Picture1, nscale, nscale
DrawGr Picture1, 0, nscale
DrawGr Picture1, 0, 0

End Sub
place in a module
Code:
Public Const PI2 = 6.28318530717958
Public Sub MoveGr(Pic As PictureBox, x As Single, y As Single)
With Pic
.CurrentX = x
.CurrentY = y
End With
End Sub
Public Sub DrawGr(Pic As PictureBox, x As Single, y As Single)
With Pic
Pic.Line (.CurrentX, .CurrentY)-(x, y), RGB(255, 0, 0)

End With
End Sub
Public Function Maximum(rR As Single, rG As Single, rB As Single) As Single
   If (rR > rG) Then
      If (rR > rB) Then
         Maximum = rR
      Else
         Maximum = rB
      End If
   Else
      If (rB > rG) Then
         Maximum = rB
      Else
         Maximum = rG
      End If
   End If
End Function
Public Function Minimum(rR As Single, rG As Single, rB As Single) As Single
   If (rR < rG) Then
      If (rR < rB) Then
         Minimum = rR
      Else
         Minimum = rB
      End If
   Else
      If (rB < rG) Then
         Minimum = rB
      Else
         Minimum = rG
      End If
   End If
End Function
Public Sub Polar2Cartesian(ByVal angle As Single, distance As Single, pointX As Single, pointY As Single, pointToX As Single, pointToY As Single)
angle = PI2 / 360 * angle
angle = angle / PI2
angle = (angle - Fix(angle)) * PI2
pointToX = pointX + Cos(angle) * distance
pointToY = pointY - Sin(angle) * distance
End Sub
Public Function Trans(ValueV As Single, MinV, MaxV, s As Single) As Single
Trans = (ValueV - MinV) / (MaxV - MinV) * s
End Function
-
Aug 9th, 2015, 02:52 PM
#23
Re: Plotting scaled triangle
Remove Form_load, add a timer with 50 milisecond
To change triagle angles you have to define one of them (one angle, two distances)
Code:
............
Polar2Cartesian k - 120, 900, x1, y1, x2, y2    'here  is the angle
............
Code:
Dim k As single
Private Sub Timer1_Timer()
Picture1.Cls
drawMe k
Picture1.Refresh
k = k + 5
End Sub
Last edited by georgekar; Aug 9th, 2015 at 02:56 PM.
-
Aug 10th, 2015, 11:02 PM
#24
Re: Plotting scaled triangle
George, what you're doing is a "triangle-rotation within square-bounds"
(scaled, to fit optimally within that bounding-square).
I'd think that this meets what .paul had in mind only half-ways.
FWIW, your code is (IMO) also not as readable as it could be, since the requirement
of rotating an arbitrary amount of Points (and then scaling the result within the
bounds of a given square-region), can be expressed as below...
Into a Module (not depending on any helper-lib, just plain VB6)
Code:
Sub ApplyRotation(SrcPts#(), DstPts#(), ByVal Ang#, ByVal Size#)
Dim x&, y&, xMin#, xMax#, yMin#, yMax#, dx#, dy#, xc#, yc#

  ReDim DstPts(0 To UBound(SrcPts))

  xMin = 1E+99: xMax = -1E+99: yMin = 1E+99: yMax = -1E+99
  For x = 0 To UBound(SrcPts) Step 2: y = x + 1
    DstPts(x) = SrcPts(x) * Cos(Ang) - SrcPts(y) * Sin(Ang)
    DstPts(y) = SrcPts(y) * Cos(Ang) + SrcPts(x) * Sin(Ang)

    If xMin > DstPts(x) Then xMin = DstPts(x)
    If xMax < DstPts(x) Then xMax = DstPts(x)
    If yMin > DstPts(y) Then yMin = DstPts(y)
    If yMax < DstPts(y) Then yMax = DstPts(y)
  Next
  dx = xMax - xMin: dy = yMax - yMin

  If dx > dy Then yc = (dx - dy) / 2 Else xc = (dy - dx) / 2
  For x = 0 To UBound(DstPts) Step 2: y = x + 1
    DstPts(x) = (DstPts(x) - xMin + xc) * Size / IIf(dx > dy, dx, dy)
    DstPts(y) = (DstPts(y) - yMin + yc) * Size / IIf(dx > dy, dx, dy)
  Next
End Sub
So, the above is able to rotate (and fit) as many points as you want from
a given SourceArray of PolyPoints to a DestinationArray of PolyPoints.
And the special case of rendering a rotating Triangle can be written ....
Into a Form (needs a Timer, with its default-name Timer1, Interval 10):
Code:
Private SrcPts#(), DstPts#(), Deg As Long

Private Sub Form_Load() 'the Demo will work happily with any amount of Points, ...
  ReDim SrcPts(0 To 5) 'but we restrict ourselves to 3 of them for a Triangle here

  SrcPts(0) = 11: SrcPts(1) = 11
  SrcPts(2) = 99: SrcPts(3) = 11
  SrcPts(4) = 11: SrcPts(5) = 66
End Sub

Private Sub Timer1_Timer()
Const x0& = 44, y0& = 44
Dim i&, x1#, y1#, x2#, y2#

  AutoRedraw = True: ScaleMode = vbPixels
  Line (x0, y0)-(x0 + 250, y0 + 250), vbWhite, BF

  ApplyRotation SrcPts, DstPts, Deg * Atn(1) / 45, 250

  For i = 0 To UBound(DstPts) Step 2
    x1 = DstPts(i): y1 = DstPts(i + 1)
    If i = UBound(DstPts) - 1 Then
      x2 = DstPts(0): y2 = DstPts(1)
    Else
      x2 = DstPts(i + 2): y2 = DstPts(i + 3)
    End If
    Line (x0 + x1, y0 + y1)-(x0 + x2, y0 + y2), vbBlue
  Next

  Deg = (Deg + 1) Mod 360: Caption = Deg
End Sub
And here the same example with slightly differing code in the Timer-Routine, for those
who need the resulting PolygonPoints rendered with antialiasing and in SubPixel-precision
(needs a vbRichClient5-reference):
Code:
Private SrcPts#(), DstPts#(), Deg As Long

Private Sub Form_Load() 'the Demo will work happily with any amount of Points, ...
  ReDim SrcPts(0 To 5) 'but we restrict ourselves to 3 of them for a Triangle here

  SrcPts(0) = 11: SrcPts(1) = 11
  SrcPts(2) = 99: SrcPts(3) = 11
  SrcPts(4) = 11: SrcPts(5) = 66
End Sub

Private Sub Timer1_Timer()
  With Cairo.CreateSurface(640, 640).CreateContext
    .Paint , Cairo.CreateSolidPatternLng(&HBBBBBB)

    .TranslateDrawings 44.5, 44.5

    .Rectangle 0, 0, 250, 250
    .Fill , Cairo.CreateSolidPatternLng(vbWhite)

    ApplyRotation SrcPts, DstPts, Deg * Cairo.PI / 180, 250

    .Polygon DstPts, True
    .SetLineWidth 1
    .Stroke , Cairo.CreateSolidPatternLng(vbBlue)

    Set Picture = .Surface.Picture
  End With

  Deg = (Deg + 1) Mod 360: Caption = Deg
End Sub
Olaf
Last edited by Schmidt; Aug 11th, 2015 at 12:09 AM.
-
Aug 12th, 2015, 12:28 PM
#25
Re: Plotting scaled triangle
I think I do exactly what OP want. But my maths works with less cos/sin...and the way I rescale the triangle and fit in the square, is always with any of two, height or width at 250 pixels.I am writing from a tablet,so when I have my test computer in front of me I do a test run to your code.
George
-
Aug 12th, 2015, 12:33 PM
#26
Re: Plotting scaled triangle
I leave these two lines for a scope
angle = PI2 / 360 * angle
angle = angle / PI2
First line is for degree to radian conversion. To optimise the code we can make these two lines in one. Angle= angle * 360.
-
Aug 12th, 2015, 06:11 PM
#27
Re: Plotting scaled triangle
When we have distance and angle then we didn't need to get two points to rotate them (4 cos and 4 sin needed). First, the first point is in the right position, the other point need to find only one cos and one sin on distance (thats why is different from the other way of a set of two points). Each time we found the next right position we process the next (angle, distance) to find point (X, Y). So for 10 points if we have starting X, Y and a set of 9 distances and angles then we can print in any rotation (from X, Y) calculate only 9 cos and 9 sin.
For the other method...you need a set of 10 points and 20 cos and 20 sin to calculate, it is 22 more (50%+) calculations. We can use scale in the pollar coordinates with a factor only on distances..So to resize we need only 9 multiplications.
In my code I have to rescale using min max so for this reason I do one set of calculations to find the points (2 from 3) and then I do a rescale and move to a new origin based in min X and min Y of points. I do not use a default min and max value, I do a compare between.
Polar coordinates used (as alternative) in M2000 in commands like Step, Draw, Polygon and Curve.
(my system use absolute angle and relative distance from graphic cursor)
-
Aug 12th, 2015, 06:15 PM
#28
Re: Plotting scaled triangle
Why do you VB6 people do everything the hard way?
- Coding Examples:
- Features:
- Online Games:
- Compiled Games:
-
Aug 12th, 2015, 10:03 PM
#29
Re: Plotting scaled triangle
Originally Posted by .paul.
Why do you VB6 people do everything the hard way?
Why do you VB* people do everything the hard way? Weakly typed languages for the win. 
(Though to be fair, the .NET IDE is really quite nice.)
The time you enjoy wasting is not wasted time.
Bertrand Russell
<- Remember to rate posts you find helpful.
-
Aug 13th, 2015, 12:40 AM
#30
Re: Plotting scaled triangle
Originally Posted by .paul.
Why do you VB6 people do everything the hard way?
Dunno, maybe because the "hard way" leads to half the code-size as in .NET? 
Here's my updated VB6-Class, which will produce exactly the same results as the one
in your posting #21 (now supporting Rotation as well)...
Class cTriangle:
Code:
Private mPath As cCairoPath, x1#, y1#, x2#, y2# '<- Bounding-Rect-Coords

Friend Sub Init(sideB, angleA, angleC, Optional RotDeg)
Dim sideC, M As cCairoContext
    sideC = sideB * Sin(angleC) / Sin(Cairo.PI - angleA - angleC)

    Set M = Cairo.WidgetBase.MeasureContext
        M.RotateDrawingsDeg -RotDeg 'apply the given rotation
            M.MoveTo 0, 0 'Move to Point A
            M.LineTo Cos(angleA) * sideC, Sin(angleA) * sideC 'Line to Point B
            M.LineTo sideB, 0 'Line to Point C
            M.ClosePath 'Close (back to Point A)
        M.MatrixResetToIdentity 'restore the Matrix before readout

    M.GetPathExtents x1, y1, x2, y2 'store the BoundingRect-extents class-internally
    Set mPath = M.CopyPath 'as well as the resulting Path (with it's internal coords)
End Sub

Public Sub ApplyScaledPathTo(CC As cCairoContext, dx, dy, Optional Scl)
  CC.Save
    Scl = IIf(dx / (x2 - x1) < dy / (y2 - y1), dx / (x2 - x1), dy / (y2 - y1))
    CC.TranslateDrawings -x1 * Scl, y1 * Scl + dy  'shift-down (due to neg. y-Scale)
    CC.ScaleDrawings Scl, -Scl 'neg. Value for the yScale ensures Bottom-Up-behaviour
    CC.AppendPath mPath
  CC.Restore
End Sub
And the Form-Code, which shows how to init and plot 4 different Triangles with above Class:
Code:
Private Triangles(0 To 3) As New cTriangle, i As Long
Private Sub Form_Load()
Const Deg2Rad = 0.017453292519943, RotDeg = 145
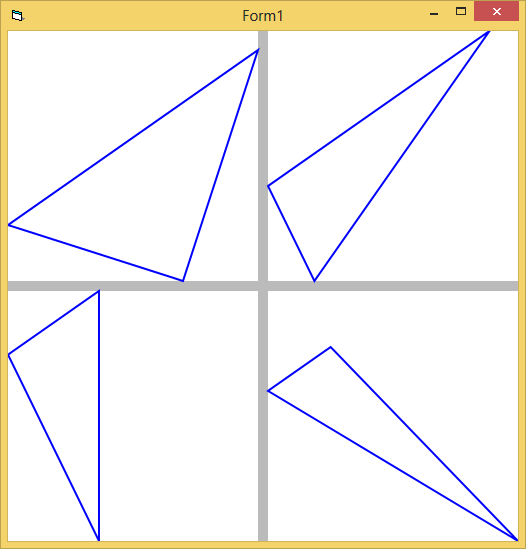
Triangles(0).Init 1, Deg2Rad * 37, Deg2Rad * 53, RotDeg
Triangles(1).Init 1, Deg2Rad * 20, Deg2Rad * 99, RotDeg
Triangles(2).Init 1, Deg2Rad * 55, Deg2Rad * 99, RotDeg
Triangles(3).Init 1, Deg2Rad * 99, Deg2Rad * 66, RotDeg
Picture = DrawTo(Cairo.CreateSurface(510, 510).CreateContext, 250, 250)
End Sub
Private Function DrawTo(CC As cCairoContext, dx, dy) As StdPicture
CC.Paint 1, Cairo.CreateSolidPatternLng(&HBBBBBB)
For i = 0 To UBound(Triangles)
CC.Rectangle 0, 0, dx, dy
CC.Fill , Cairo.CreateSolidPatternLng(vbWhite)
Triangles(i).ApplyScaledPathTo CC, dx, dy
CC.Stroke , Cairo.CreateSolidPatternLng(vbBlue)
CC.TranslateDrawings (dx + 10) * Sgn(-i Mod 2 + 0.5), (i Mod 2) * (dy + 10)
Next
Set DrawTo = CC.Surface.Picture
End Function
Rendering-Output of the above Code:
@jemidiah
Since Plotting is asked for, you will have to use some drawing-lib in Python as well,
and the cairo-binding for Python will surely not allow anything leaner than what's shown above.
Olaf
Last edited by Schmidt; Aug 13th, 2015 at 12:47 AM.
-
Aug 13th, 2015, 02:05 PM
#31
Re: Plotting scaled triangle
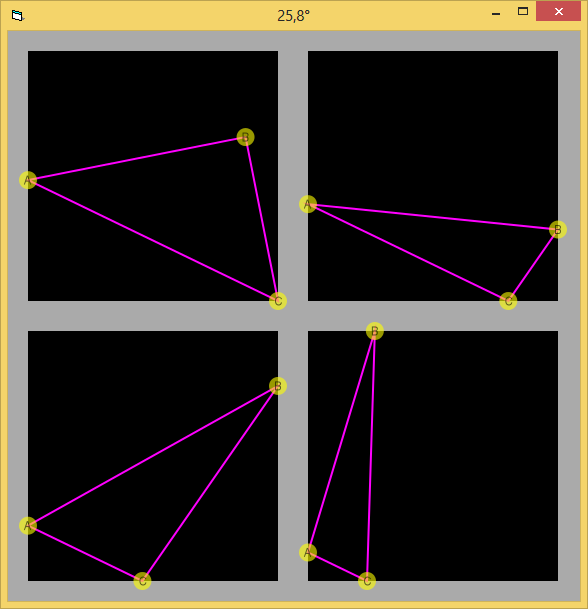
For those interested, how the whole thing would behave in an animation - with regards
to rendering-precision, also providing a Test-Case for the full range of the Rotation-Angle
which is now allowed - below is some code which shall also be my final throw at this topic
(now including a semitransparent CornerPoint-TextLabeling, to see better, where everything "ends up").
The cTriangle Class again...
Code:
Option Explicit

Private mPath As cCairoPath, Scl, x1#, y1#, x2#, y2# '<- Bounding-Rect-Coords

Friend Sub Init(sideB, angleA, angleC, Optional RotDeg#)
Dim sideC, M As cCairoContext
    sideC = sideB * Sin(angleC) / Sin(Cairo.PI - angleA - angleC)

    Set M = Cairo.WidgetBase.MeasureContext
        M.RotateDrawings -CDbl(Cairo.PI * RotDeg / 180)   'apply the given rotation
            M.MoveTo 0, 0 'Move to Point A
            M.LineTo Cos(angleA) * sideC, Sin(angleA) * sideC 'Line to Point B
            M.LineTo sideB, 0 'Line to Point C
            M.ClosePath 'Close (back to Point A)
        M.MatrixResetToIdentity 'restore the Matrix before readout

    M.GetPathExtents x1, y1, x2, y2  'store the BoundingRect-extents class-internally
    Set mPath = M.CopyPath(True) 'as well as the resulting Path (with it's internal coords)
End Sub

Public Sub DrawScaledPathTo(CC As cCairoContext, dx, dy)
  CC.Save
    Scl = IIf(dx / (x2 - x1) < dy / (y2 - y1), dx / (x2 - x1), dy / (y2 - y1))
    CC.TranslateDrawings -x1 * Scl, y1 * Scl + dy  'shift-down (due to neg. y-Scale)
    CC.ScaleDrawings Scl, -Scl 'the neg. Value for the yScale ensures Bottom-Up-behaviour
    CC.AppendPath mPath
  CC.Restore
End Sub

Public Sub DrawCornerCaptionsTo(CC As cCairoContext, dx, dy, ParamArray P())
Dim i, EntryType As cairo_path_data_type_enm, x#, y#
  For i = 0 To mPath.EntriesCount - 2
    mPath.GetPathEntry i, EntryType, x, y

    CC.ARC (x - x1) * Scl, dy + (y1 - y) * Scl, 9
    CC.Fill , Cairo.CreateSolidPatternLng(vbYellow, 0.6)

    CC.TextOut (x - x1) * Scl - 4, dy + (y1 - y) * Scl - 7.5, CStr(P(i)), , , True
    CC.Fill , Cairo.CreateSolidPatternLng(vbBlack, 0.6)
  Next
End Sub
And the Form-Code for the rotating Animation (in 1/10 of a Degree) for 4 different Triangles.
Code:
Option Explicit

Const Deg2Rad = 0.017453292519943

Private i As Long, Triangles(0 To 3) As New cTriangle
Private Srf As cCairoSurface, WithEvents tDeg As cTimer

Private Sub Form_Load()
  Set Srf = Cairo.CreateSurface(600, 600)
  Set tDeg = New_c.Timer(10, True, 0)
End Sub

Private Sub tDeg_Timer()
  tDeg.Tag = IIf(tDeg.Tag >= 359.9, 0, tDeg.Tag + 0.1)
  Caption = Format(tDeg.Tag, "0.0°")

  Triangles(0).Init 55, Deg2Rad * 37, Deg2Rad * 53, tDeg.Tag
  Triangles(1).Init 55, Deg2Rad * 20, Deg2Rad * 99, tDeg.Tag
  Triangles(2).Init 55, Deg2Rad * 55, Deg2Rad * 99, tDeg.Tag
  Triangles(3).Init 55, Deg2Rad * 99, Deg2Rad * 66, tDeg.Tag

  Set Picture = DrawTo(Srf.CreateContext, 250, 250)
End Sub

Private Function DrawTo(CC As cCairoContext, dx, dy) As StdPicture
  CC.Paint 1, Cairo.CreateSolidPatternLng(&HAAAAAA)
  CC.TranslateDrawings 20, 20

  For i = 0 To UBound(Triangles)
    CC.Rectangle 0, 0, dx, dy
    CC.Fill , Cairo.CreateSolidPatternLng(vbBlack)

    Triangles(i).DrawScaledPathTo CC, dx, dy
    CC.Stroke , Cairo.CreateSolidPatternLng(vbMagenta)

    Triangles(i).DrawCornerCaptionsTo CC, dx, dy, "A", "B", "C"

    CC.TranslateDrawings (dx + 30) * Sgn(-i Mod 2 + 0.5), (i Mod 2) * (dy + 30)
  Next

  Set DrawTo = CC.Surface.Picture
End Function
Olaf
 Posting Permissions
- You may not post new threads
- You may not post replies
- You may not post attachments
- You may not edit your posts
-
Forum Rules
|
Click Here to Expand Forum to Full Width
|


 Reply With Quote
