|
-
Dec 17th, 2009, 01:49 PM
#1
Thread Starter
Fanatic Member

PivotChart Axis fail
Hey there everyone,
I'm trying to make a pivotchart to display a summary of data from some of our plants. The problem I have is when I filter a field, one gridline goes way up to the top (beyond the top of the chart area). It's weird, and I can't figure out why it happens. It always seems to be with the same axis as well. Any ideas?
the only thing I can think of is that there's some data somewhere that's not in the filtered range that causes it to display like that, but it only does it on with some locations, not all.
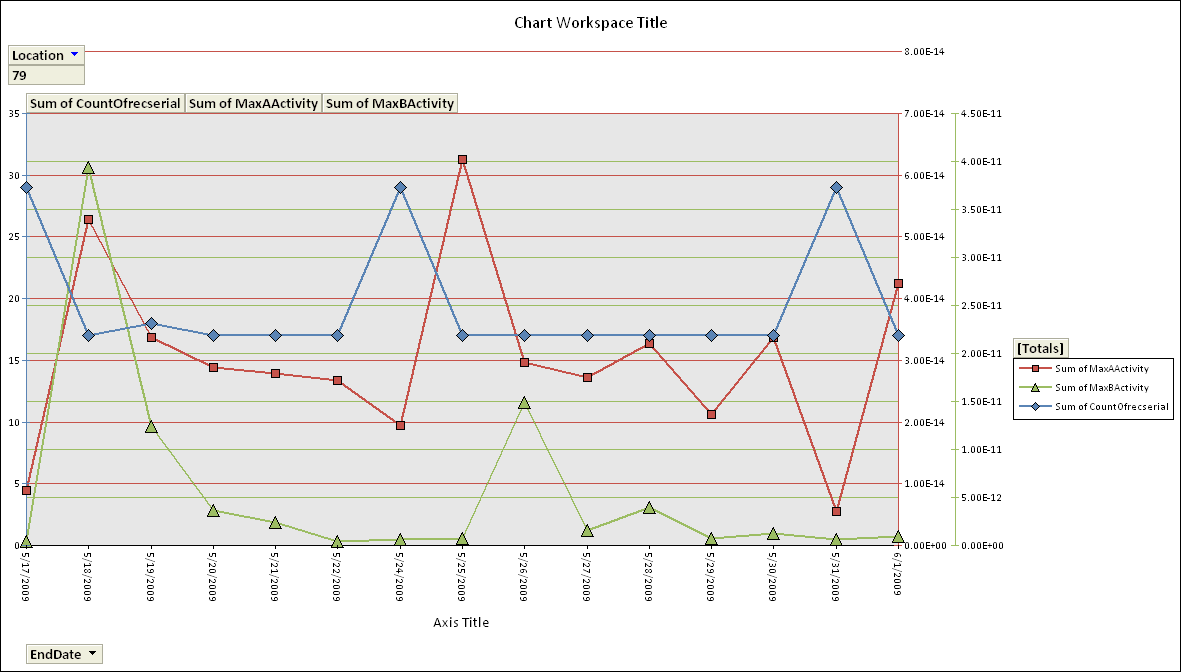
EDIT: Not sure what significance this has yet, but the only values that appear over the top like that are 2E-13 and 8E-14. Various totals don't do this.
Last edited by drag0n_45; Dec 17th, 2009 at 01:53 PM.
 Posting Permissions
- You may not post new threads
- You may not post replies
- You may not post attachments
- You may not edit your posts
-
Forum Rules
|
Click Here to Expand Forum to Full Width
|


 Reply With Quote