|

-
May 23rd, 2008, 08:48 PM
#1
Thread Starter
New Member

line that best fits
A mutual fund company has the following fee schedule:
On 50 miillion they charge: 0.75%
On 100 million they charge: 0.75%
On 200 million they charge: 0.70%
On 300 million they charge: 0.683%
On 400 million they charge: 0.675%
On 500 million they charge: 0.67%
I am trying to come up with a line that best fits. I can't do a linear regression since the data is nonlinear nor can I use the growth or linest functions in ms excel because they are for exponential growth.
What functions in excel can I use to come up with a nonlinear equation that best fits the data so that I can forecast charges for money on say 750 million dollars??? Also, can I use this equation to forecast charges on money below 50 million dollars?
Any feedback would be greatly appreciated.
-
May 24th, 2008, 01:33 PM
#2
Re: line that best fits
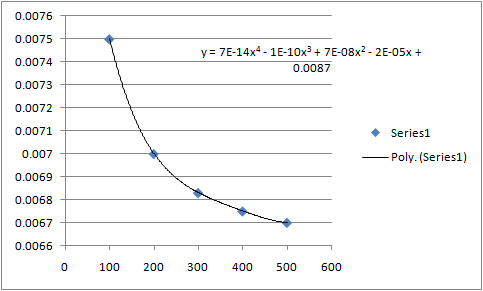
If you disregard your 50 million data point as anomalous, then you can plot a scatter graph of the other points. A polynomial power 4 trendline fits the points very well. Here's a pic:
-
May 24th, 2008, 07:35 PM
#3
Re: line that best fits
In general you can use a high-order polynomial to do non-linear fits, particularly if no exponential fit works. Here Max could have started with a quadratic fit, saw it didn't work well, moved up to a cubic fit, and finally up to the quartic fit you see there.
The time you enjoy wasting is not wasted time.
Bertrand Russell
<- Remember to rate posts you find helpful.
-
May 25th, 2008, 12:25 PM
#4
Thread Starter
New Member
Re: line that best fits
Can you tell me what functions (in Excel) you used to come up with that nice graph? You are right about the first data point, it will have to be dismissed.
-
May 27th, 2008, 03:59 PM
#5
Re: line that best fits
Using the same data and ignoring the first point, here is what I received with a polynomial, degree 4:

-
May 27th, 2008, 04:10 PM
#6
Thread Starter
New Member
Re: line that best fits
Nice R2.
I see how you are set up in Excel from the Screenshot. But what function(s) did you use so in order to derive that equation?
-
May 27th, 2008, 04:38 PM
#7
Re: line that best fits
 Originally Posted by jcavigli
Nice R2.
I see how you are set up in Excel from the Screenshot. But what function(s) did you use so in order to derive that equation?
Excel does it all. The functions are built into the Chart Wizard. Use the X-Y Scatter Plot. Then when finished, click on the chart and go to Add TrendLine from the main pull-down menu. Excel will offer a whole bundle of regression line possibilities. The higher the R-squared, the closer the fit.
I've never seen any documentation on the math functions that Excel uses to obtain the least squares line equations. Simple linear is a piece of cake, but I imagine it's pretty complex when you get to the higher order equations.
-
May 27th, 2008, 05:24 PM
#8
Thread Starter
New Member
Re: line that best fits
I am trying to display the R2 and the actual equation. I am using MS Excel 03. I have the chart area displayed and when I go to format the 'Selected Trendline' option isn't there. How do I get these 2 things? Is anything wrong with my version of Excel or do I have to install something?
-
May 28th, 2008, 10:39 AM
#9
Re: line that best fits
Originally Posted by jcavigli
I am trying to display the R2 and the actual equation. I am using MS Excel 03. I have the chart area displayed and when I go to format the 'Selected Trendline' option isn't there. How do I get these 2 things? Is anything wrong with my version of Excel or do I have to install something?
The only things I have for Add-ins is the Analysis Tool Pack and the Solver. Pull down Tools on the Main menu and select Add-ins. Bring the data Analysis tool pack on board using the check box and see if that does it.
When you click on the Chart drawing itself, the Add Trendline option should become available to connect the plotted points. The chart has to be there first before you can add the trendline.
-
May 28th, 2008, 11:19 AM
#10
Thread Starter
New Member
Re: line that best fits
Thank you. It works. I see the R2 and Equation.
Now, I will just figure out a way to design somthing that when I put in like 750 million, it will tell me the fee based upon a regression I run.

-
May 28th, 2008, 12:55 PM
#11
Re: line that best fits
Originally Posted by jcavigli
Thank you. It works. I see the R2 and Equation.
Now, I will just figure out a way to design somthing that when I put in like 750 million, it will tell me the fee based upon a regression I run.
That's not as tough as it may seem. It's called extrapolation. Enter 750 into a cell, say cell A9. Now take the final formula that the regression derived and apply it to an empty cell (say B9) using A9's value for X.
The polynomial regression is a rather long formula, so be careful as you enter it in. The equation's coefficients are rather mean devils. Excel will then calculate the expected fee, which should be about 0.66 based on Code Doc's eyeball approach. 
There may be a way to cut and paste the regression formula directly from the chart to the spread sheet's text box, but I'm not sure. Take a shot at it.
-
May 28th, 2008, 01:06 PM
#12
Thread Starter
New Member
Re: line that best fits
Thank you so much.
I will definitely try this out.
-
Jun 12th, 2008, 09:07 PM
#13
Junior Member
Re: line that best fits
In general I wouldn't recommend extrapolating data -- ie. trying to find the dependant variable when your independent variable is outside its range.
-
Jun 13th, 2008, 06:08 AM
#14
Re: line that best fits
I'd agree that extrapolating can be dangerous (because it can lead you to false conclusions, since you're using partial data). Still, for a case like this where the company is clearly using a formula, extrapolating to the right where the formula seems valid looks fine  When extrapolating you just have to carefully evaluate whether or not it's valid and not blindly extrapolate. When extrapolating you just have to carefully evaluate whether or not it's valid and not blindly extrapolate.
The time you enjoy wasting is not wasted time.
Bertrand Russell
<- Remember to rate posts you find helpful.
 Posting Permissions
- You may not post new threads
- You may not post replies
- You may not post attachments
- You may not edit your posts
-
Forum Rules
|
Click Here to Expand Forum to Full Width
|


 Reply With Quote


